Navigation
SVG drawings can be used to open a form to view or modify parameters or to open related documents such as photos or manuals. This is implemented by adding information on the name of the subtopic to the link. For example, a certain rectangle can be marked with the topic 'area_215' so that if a user clicks on this rectangle a form with information on that area an be displayed.
Drawing
The fourth line from below in the script shows the link function. The second argument, which defines the topic, is created by the text area_ followed by the number of the area.
var data = {
  area_215:{color:"red"},
  area_219:{color:"yellow"},
  area_218:{color:"grey"}
}
svg("floorplan.svg")
const areas = new Map([
  ["215", [20,220,160,160]],["212", [20,385,160,165]],
  ["218", [110,60,70,70]],["219", [185,70,105,80]],
  ["220", [295,70,105,80]],["221", [405,70,105,80]],
  ["222", [515,70,105,80]],["223", [625,70,105,80]],
  ["D3", [210,205,60,65]],["D5", [292,225,62,62]],
  ["D4", [292,290,62,60]],["D7", [210,275,62,75]],
  ]
)
width(1);
for (let area of areas.keys()) {
  let shape = areas.get(area)
  let color = data['area_' + area]?.color ?? "white"
  transparency(80)
  fill(color)
  fontSize("10pt")
  link(data, 'area_' + area)
  rectangle(...shape)
  text(area, shape[0]+shape[2]/2 - 10, 10 + shape[1] + shape[3]/2)
}
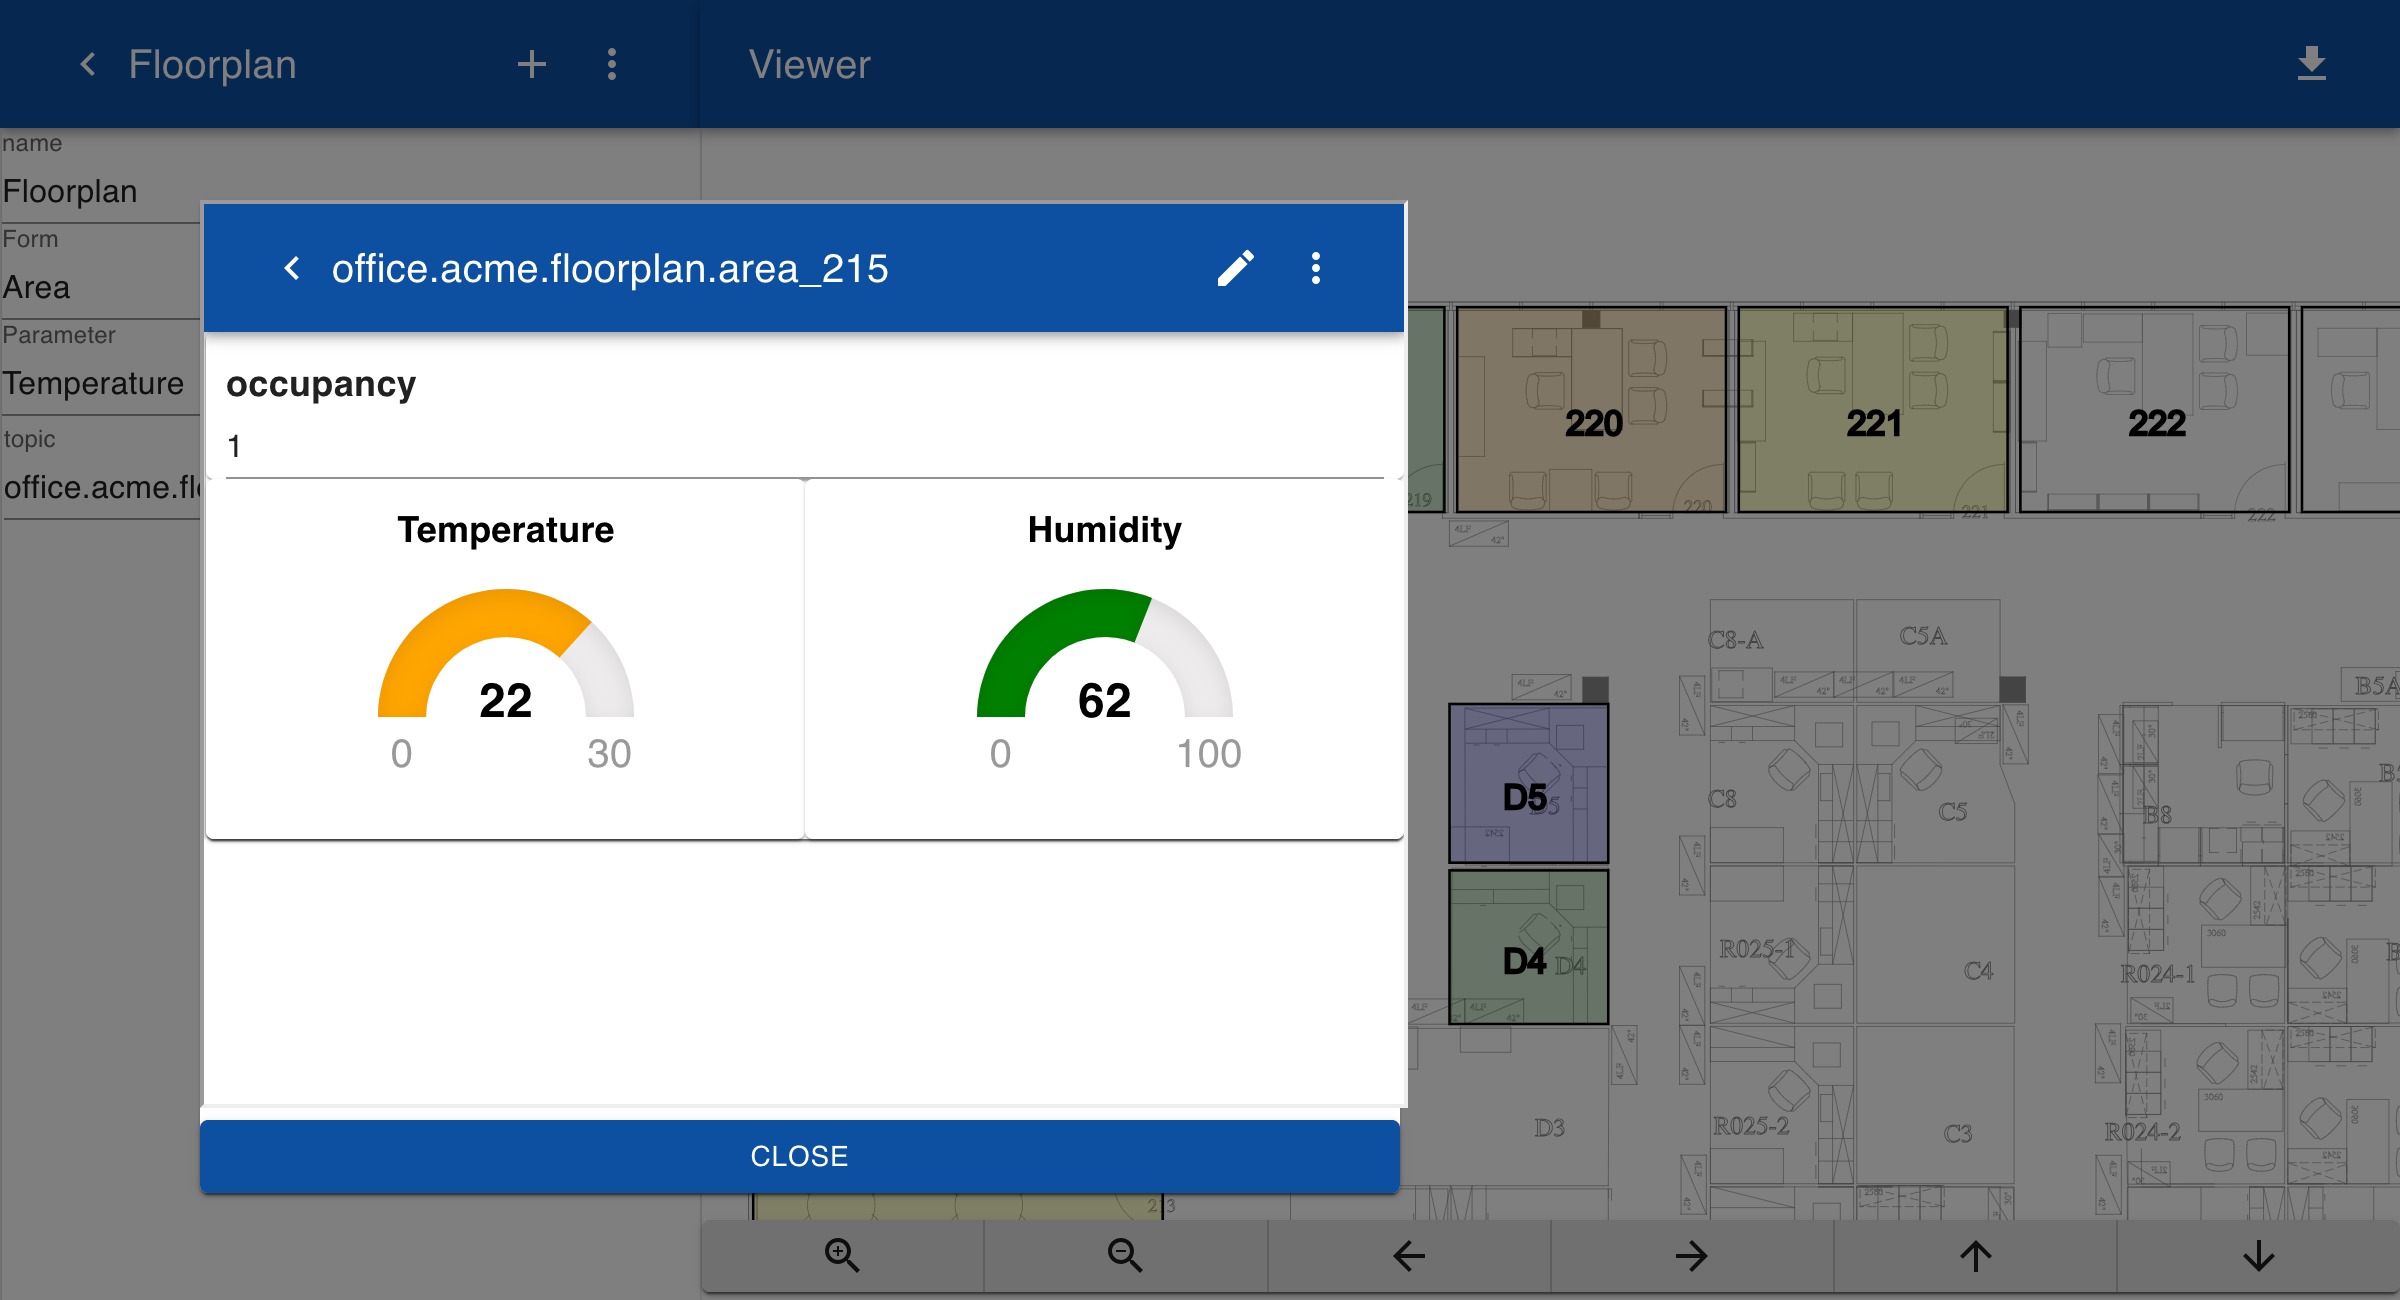
Form
The form area has been change to include a field for showing the current occupancy state of the area.
Area

Occupancy

Temperature
[0|15:blue,15|18:yellow,18|21:green,21|23:orange,23|30:red 00]

Humidity
[0|10:red,10|50:yellow,50|80:green,80|100:blue 00]
Diagram
If you click on an item in the drawing, the form with details about the selected area is displayed. You can set the form in edit mode to update the values.