Colors
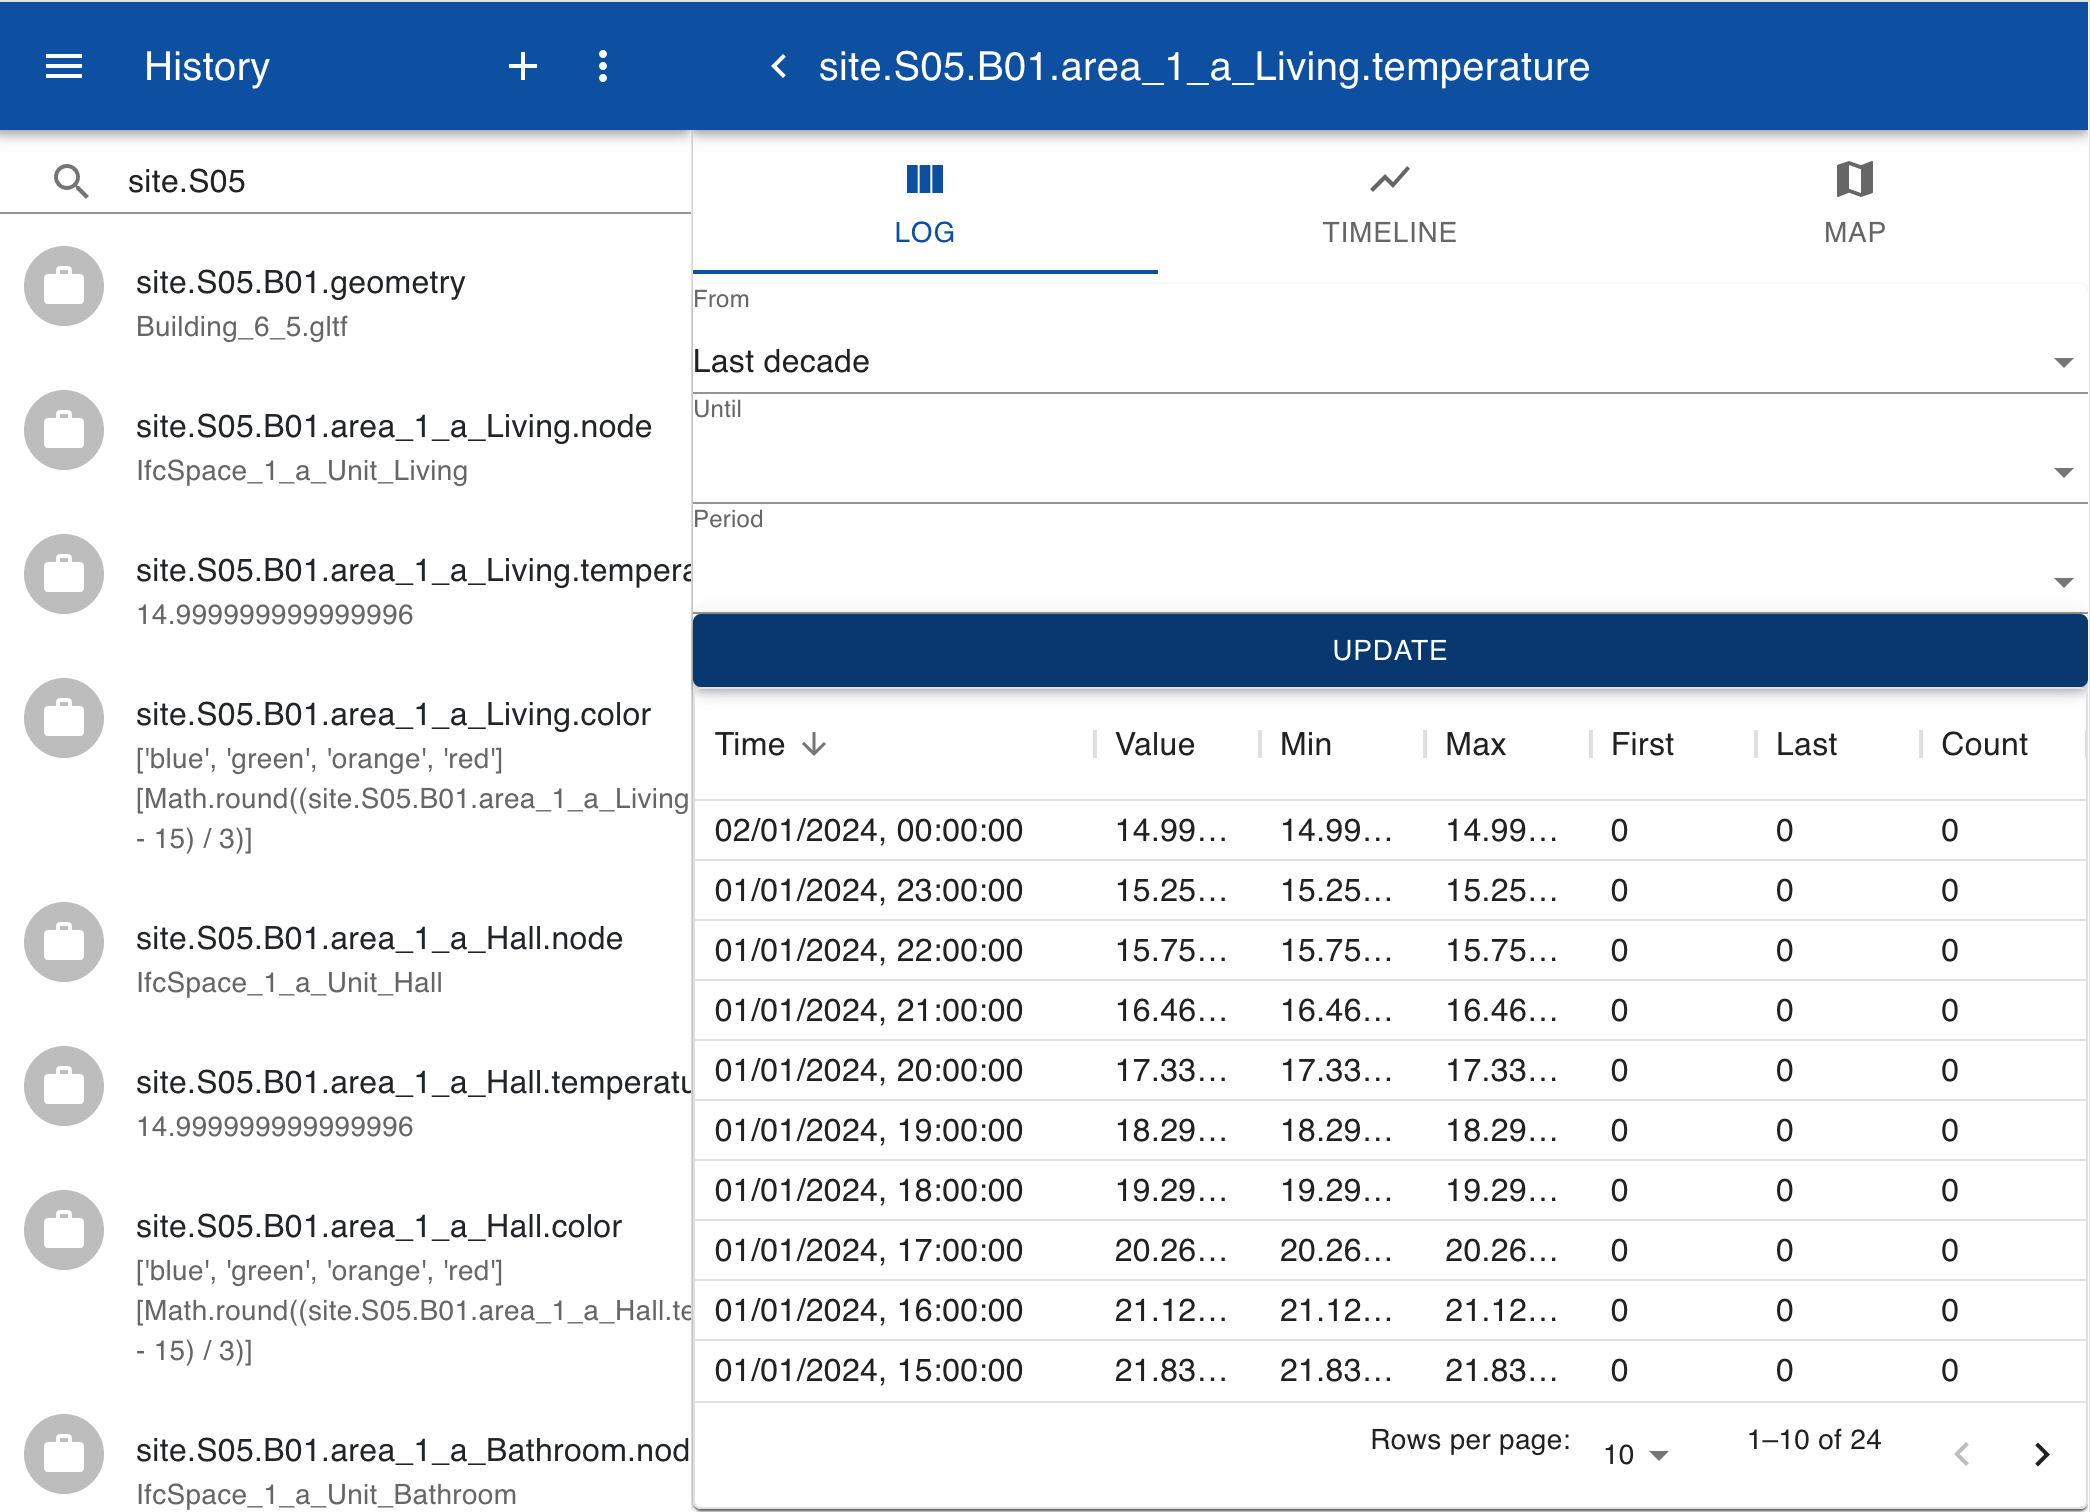
You can view the historical data of a property such as temperature of a room in a table or a line chart. The example below shows how the temperature of a room changes during the day. The temperature of the room may also be dependent on the level in a building.
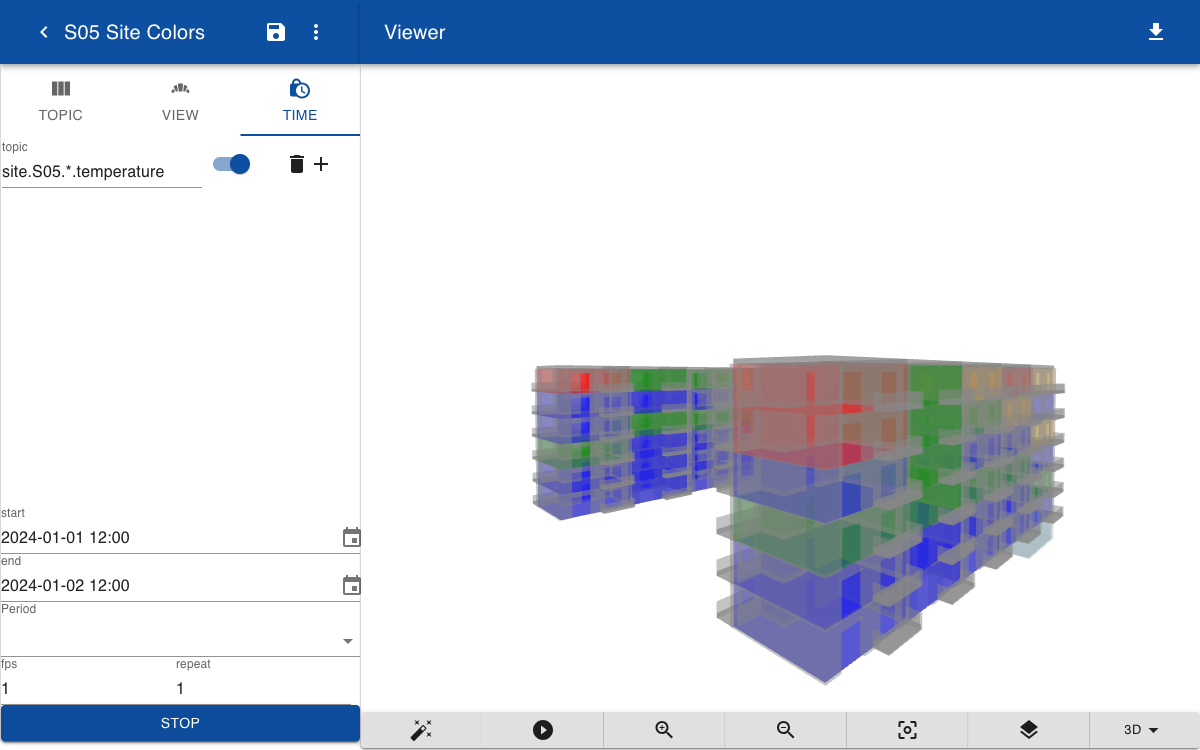
To show how the temperature of all areas change during the day you can click on the time tab. Add one of more topics that you want to animate. The topics may include wildcards, for example site.S05.*.temperature loads the temperature topics of all areas. Next, specify a start time and end time and optionally a period for aggregation. If temperature data is available per minute and you want to see the changes per hour you enter the period hour. Click on animate to show a 3D animation of the temperatures during the day.