Visual Mode
IoT data in a digital twin can be displayed in dashboards with charts, graphs, gauges and other graphical elements. In this section we will show how to create more complex visualizations such as process diagrams, flow charts, and other graphical elements. The basis for displaying 2D graphics is the SVG file format. SVG (Scalable Vector Graphics) is a vector graphics format that can be scaled to any size without losing quality. It is widely used for creating logos, icons, illustrations, and other graphics that need to be displayed at different sizes. It is supported by most modern web browsers and can be used to create interactive graphics such as maps, charts, and diagrams for displaying IoT data.
Drawing
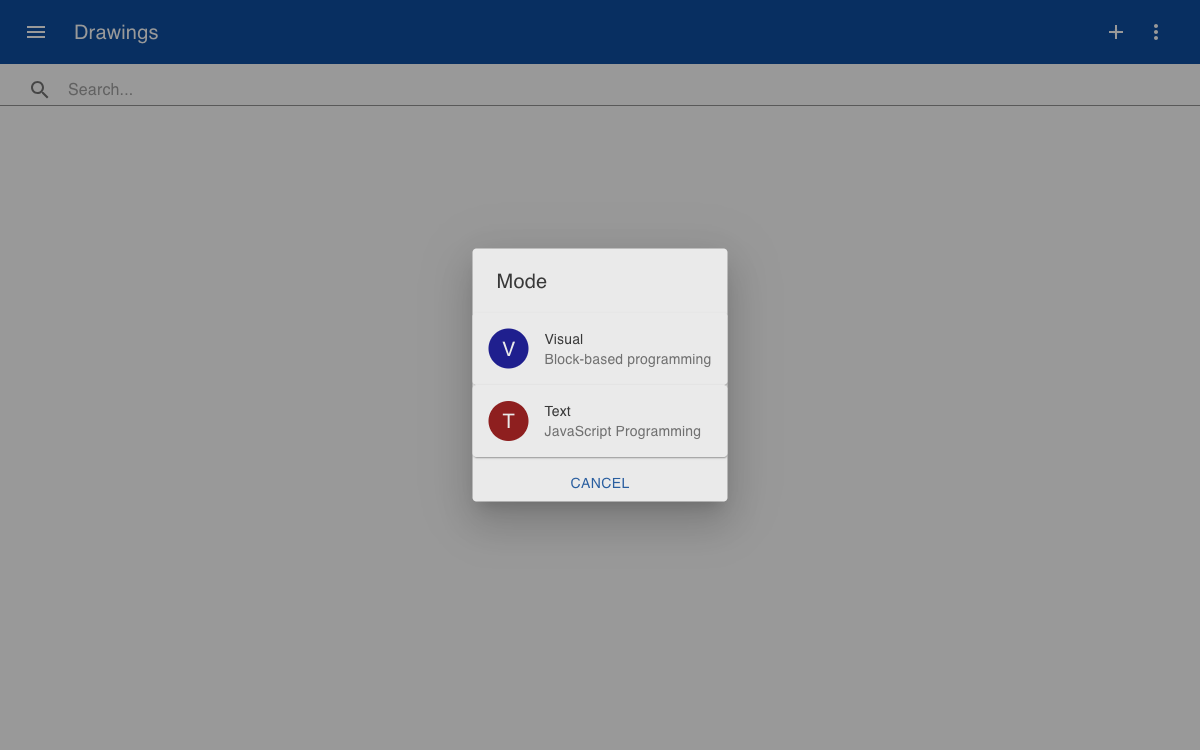
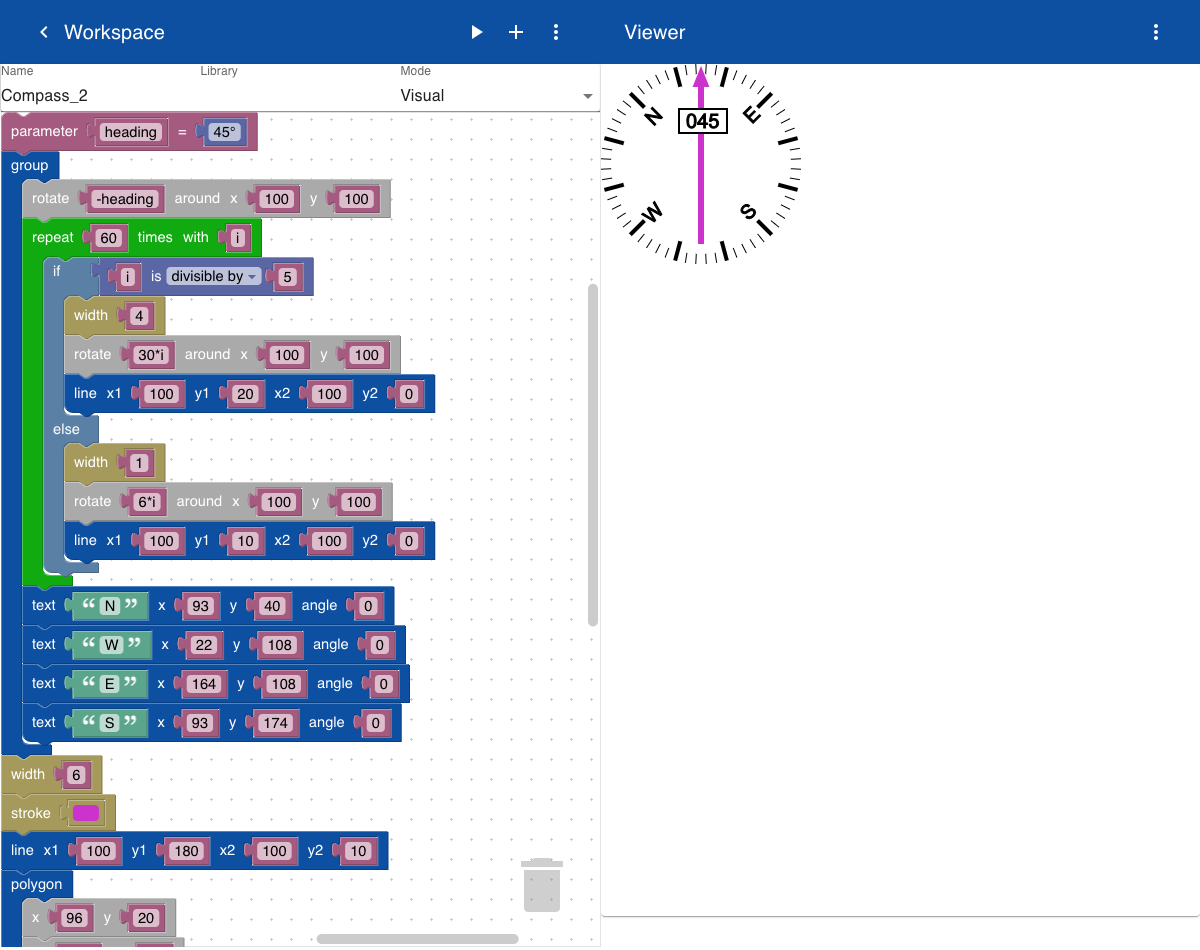
You can use a visual programming environment to create parametric SVG drawings that are stored in a library on the server. Click on the + button to create a new drawing and the select the option Visual. This opens a workspace and a viewer for creating SVG elements. In this example we show the creation of a simple SVG graphic for a compass.
 In the workspace click on
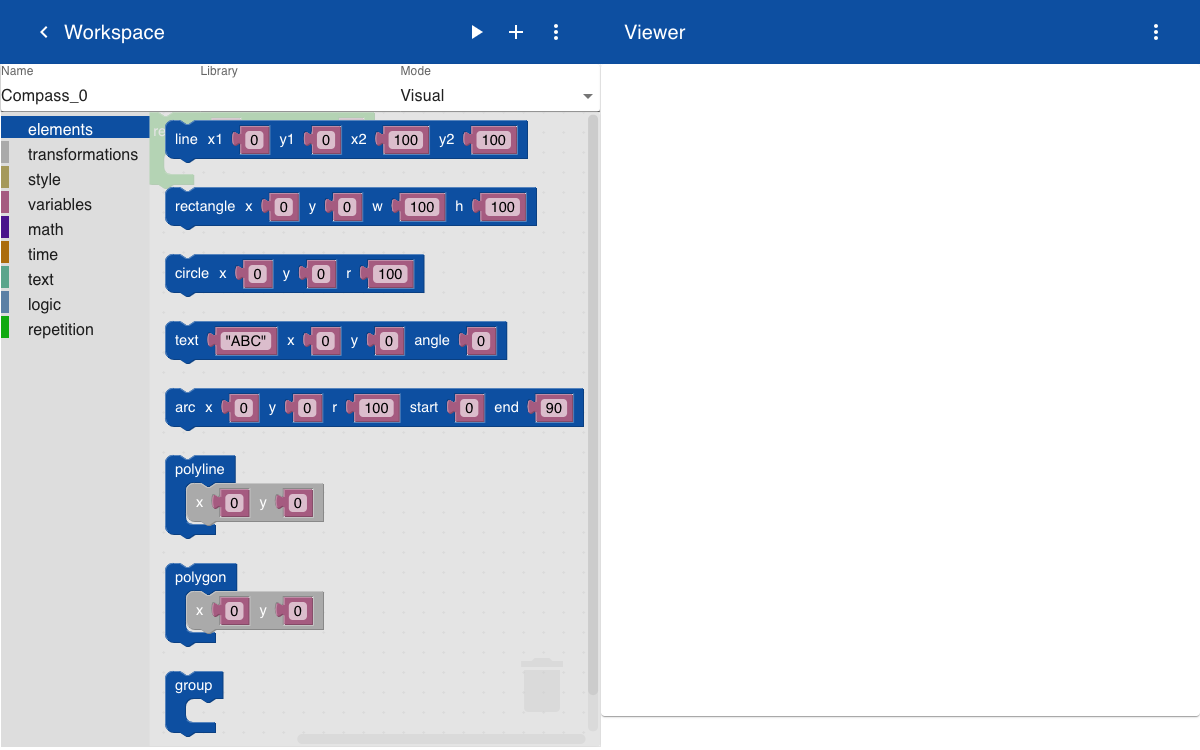
 + to show a menu with the available SVG elements, such as lines, rectangles, circles, etc. The elements can be dragged and dropped into the workspace to create the desired graphic. To move or rotate the elements, you can click and drag the transform statements.
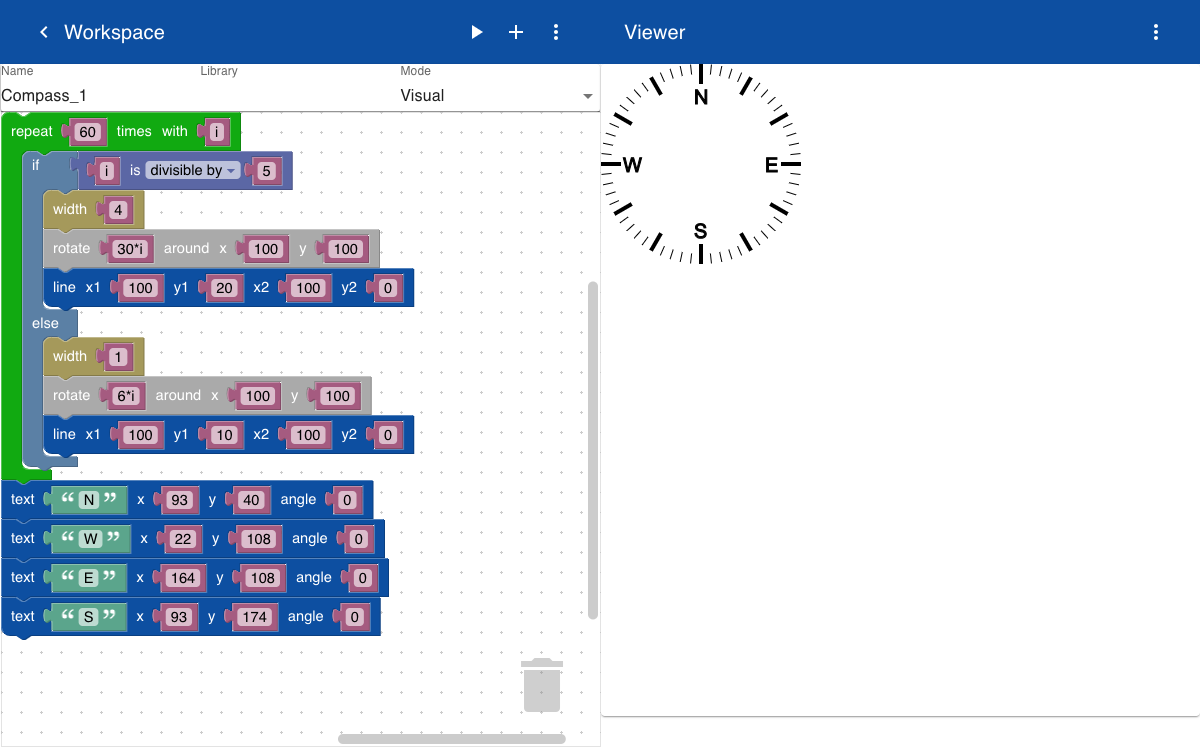
The basic shape of the compass is a circle with a thin and thick lines indicating the minutes. The lines are created inside a repeat statement where the angle is increased by 6 degrees. If the degrees are divisible by '5', the width of the line is thicker. The text element is used to display the four directions on the compass.
In this type of compass the line that indicates the direction always points upwards. The current direction is indicated by a textual representation and by rotating the graphics that shows the minutes. This rotation is done by inserting the elements that need to be rotated inside a group block and adding a rotation inside the group. This way the rotation does not apply to the magenta line that shows the direction. To control the display of the direction a parameter called heading is added. This parameter can be provided as an argument when the drawing is created.
SVG
After a drawing is created it can be used in a web page. The following example shows how to embed an SVG graphic that was created with the visual programming environment.
The page includes two instances of the same SVG graphic. The first instance only includes the name of the drawing. The second instance includes the name and a parameter for the heading. When no parameter is provided the default heading used in the script is used.
<html>
<body>
<table>
  <tr>
    <td>
      <img src="http://localhost:8010/drawings/svg/Compass" height="200">
    </td>
    <td>
      <img src="http://localhost:8010/drawings/svg/Compass(130)" height="200">
    </td>
  </tr>
</table>
</body>
</html>
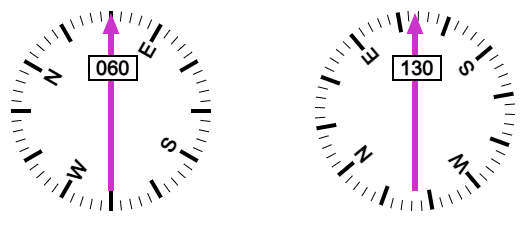
An example of the output is shown below. The HTML page with the embedded SVG graphic is opened in a standard web browser. There is no need for browser plugins or extensions, because the display of SVG is native to the browser. The first image shows the default heading used in the script. The second image shows the heading parameter used in the script. In this example the heading parameters are hard coded into the script. In a real application the heading parameter would be provided by IoT parameters. This will be discussed in a later section.
