Control
Drawings can be used to display IoT values stored in topics and values can also be modified by clicking on elements in the drawing. In this example we show how this can be used to display the current state of an irrigation system and how the user can control it by clicking on valves and pump in the drawing.
MQTT
We use the free and open source MQTT client 'mosquitto_pub' to send a message with the state information. The host is the free MQTT host broker.hivemq.com and the topic is spacetime/irrigation followed by the ID of the irrigation system. The message is a JavaScript object with fields and values for the pump and valves.
mosquitto_pub -h broker.hivemq.com -t spacetime/irrigation/front -m "{pump:1, valve1:0, valve2:0, valve3:0}"
mosquitto_pub -h broker.hivemq.com -t spacetime/irrigation/back -m "{pump:0, valve1:1, valve2:0, valve3:0}"
Connector
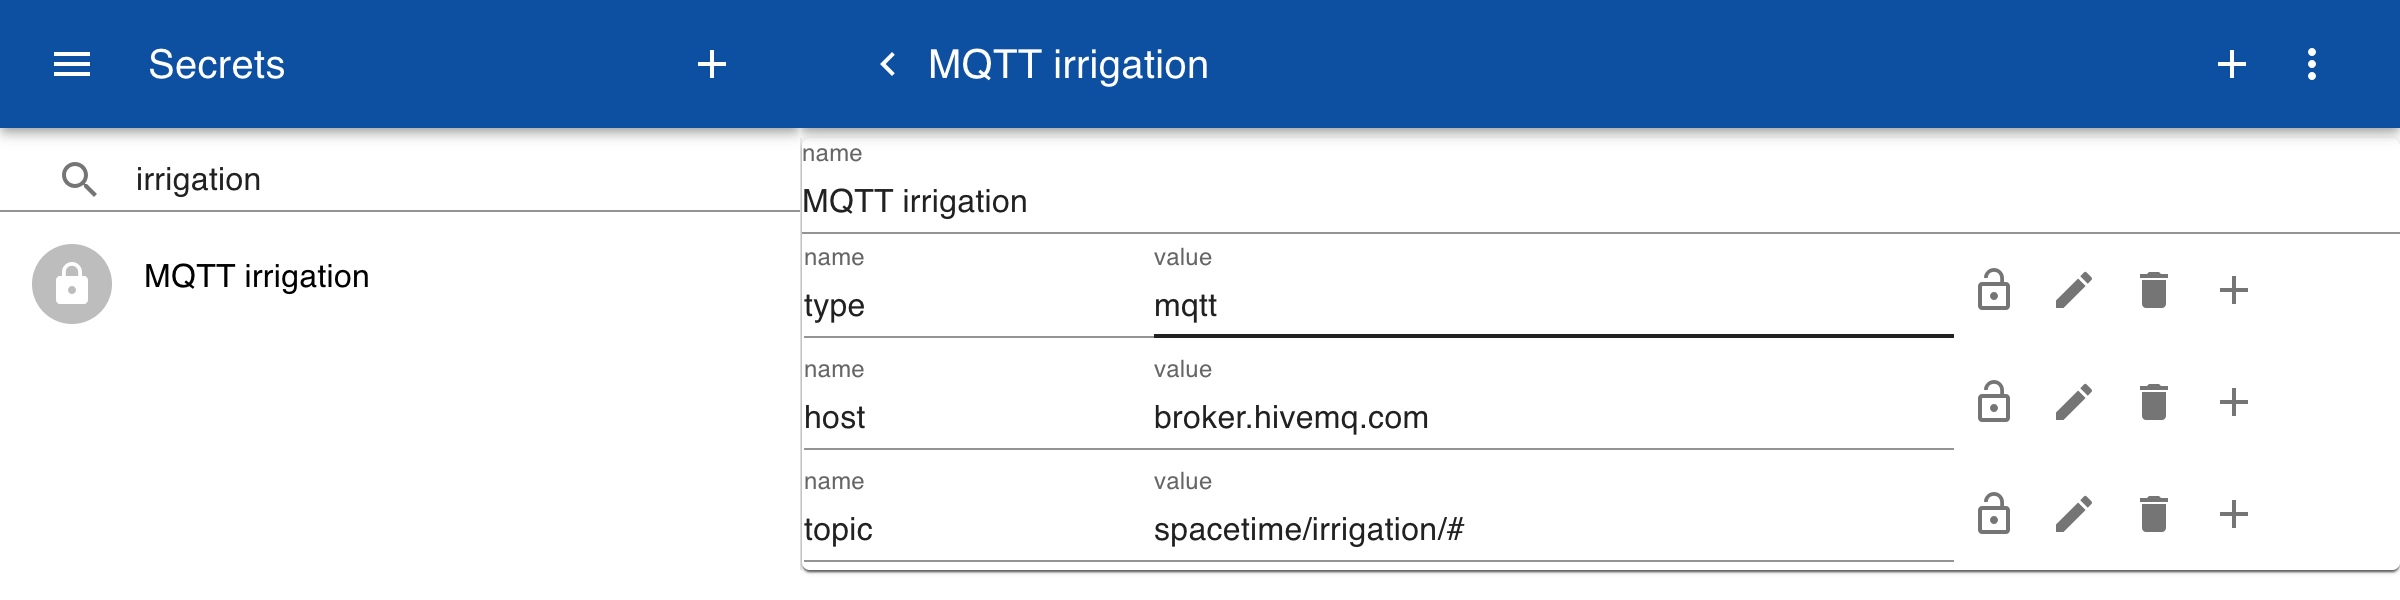
To receive the messages we first define a secret to store the information for the MQTT host. The type is set to MQTT and a free public domain host broker.hivemq.com is entered. This host does not need authentication. Then we specify the topic to which we want to subscribe. The # sign means that we want to subscribe to all subtopics.
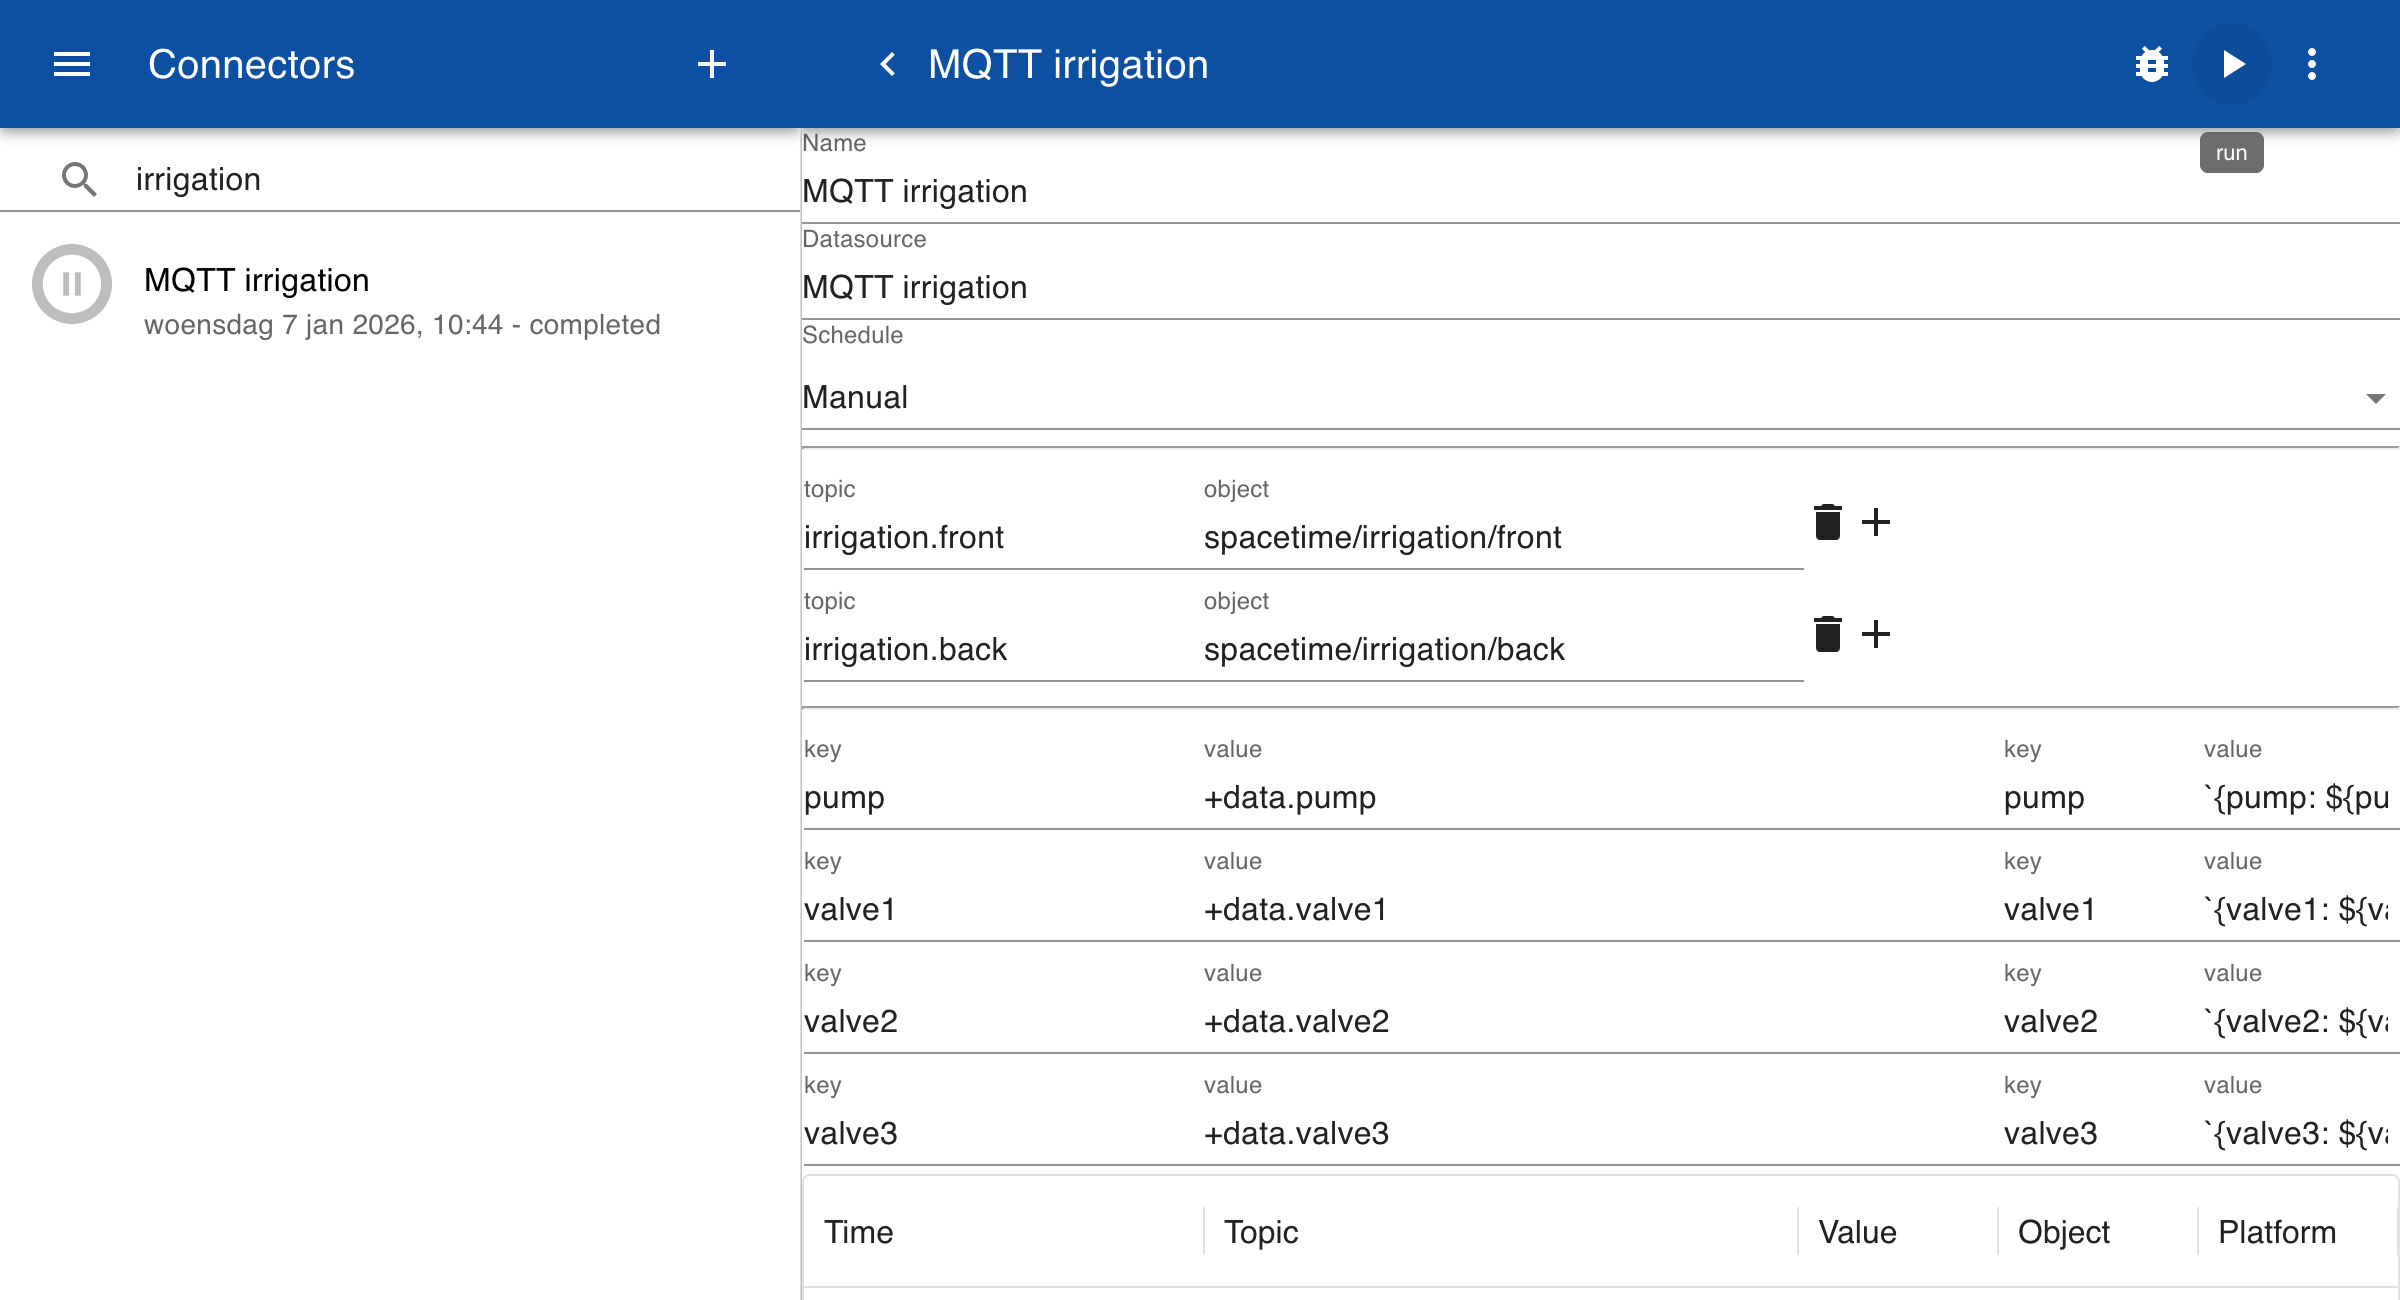
Create a new connector and add two object mappings. For each topic define the corresponding mapping to the MQTT topic and then click on test. In the data field you can see how the information from the MQTT host is mapped to a JSON object. The topic is stored in the object field and the message is stored in the data field.
[
  {
    "object": "spacetime/irrigation/front",
    "data": {
      "pump": 1,
      "valve1": 0,
      "valve2": 0,
      "valve3": 0.
    },
    "time": "2026-01-05T14:11:03.641Z"
  },
  {
    "object": "spacetime/irrigation/back",
    "data": {
      "pump": 0,
      "valve1": 1,
      "valve2": 0,
      "valve3": 0.
    },
    "time": "2026-01-05T14:11:09.149Z"
  }
]
Topics
The example below shows how to link IoT values stored in topics to the drawing. The topics are connected to the drawing with the geometry attribute. This includes the name of the drawing and a single parameter, in this case the name of the topic 'irrigation_0'.
irrigation.front.geometry = Irrigation(irrigation.front)
irrigation.front.pump = 1
irrigation.front.valve1 = 0
irrigation.front.valve2 = 0
irrigation.front.valve3 = 0
irrigation.front.scale = 0.5, 0.5
When a name of a topic is specified, the parameter is converted to a JSON object that contains the fields and values of the sub topics. So in this case the irrigation.front topic is converted to the following object:
let irrigation.front = {
    "pump": 1,
    "valve1": 0,
    "valve2": 0,
    "valve3": 0,
    "scale": 0.5, 0.5
}
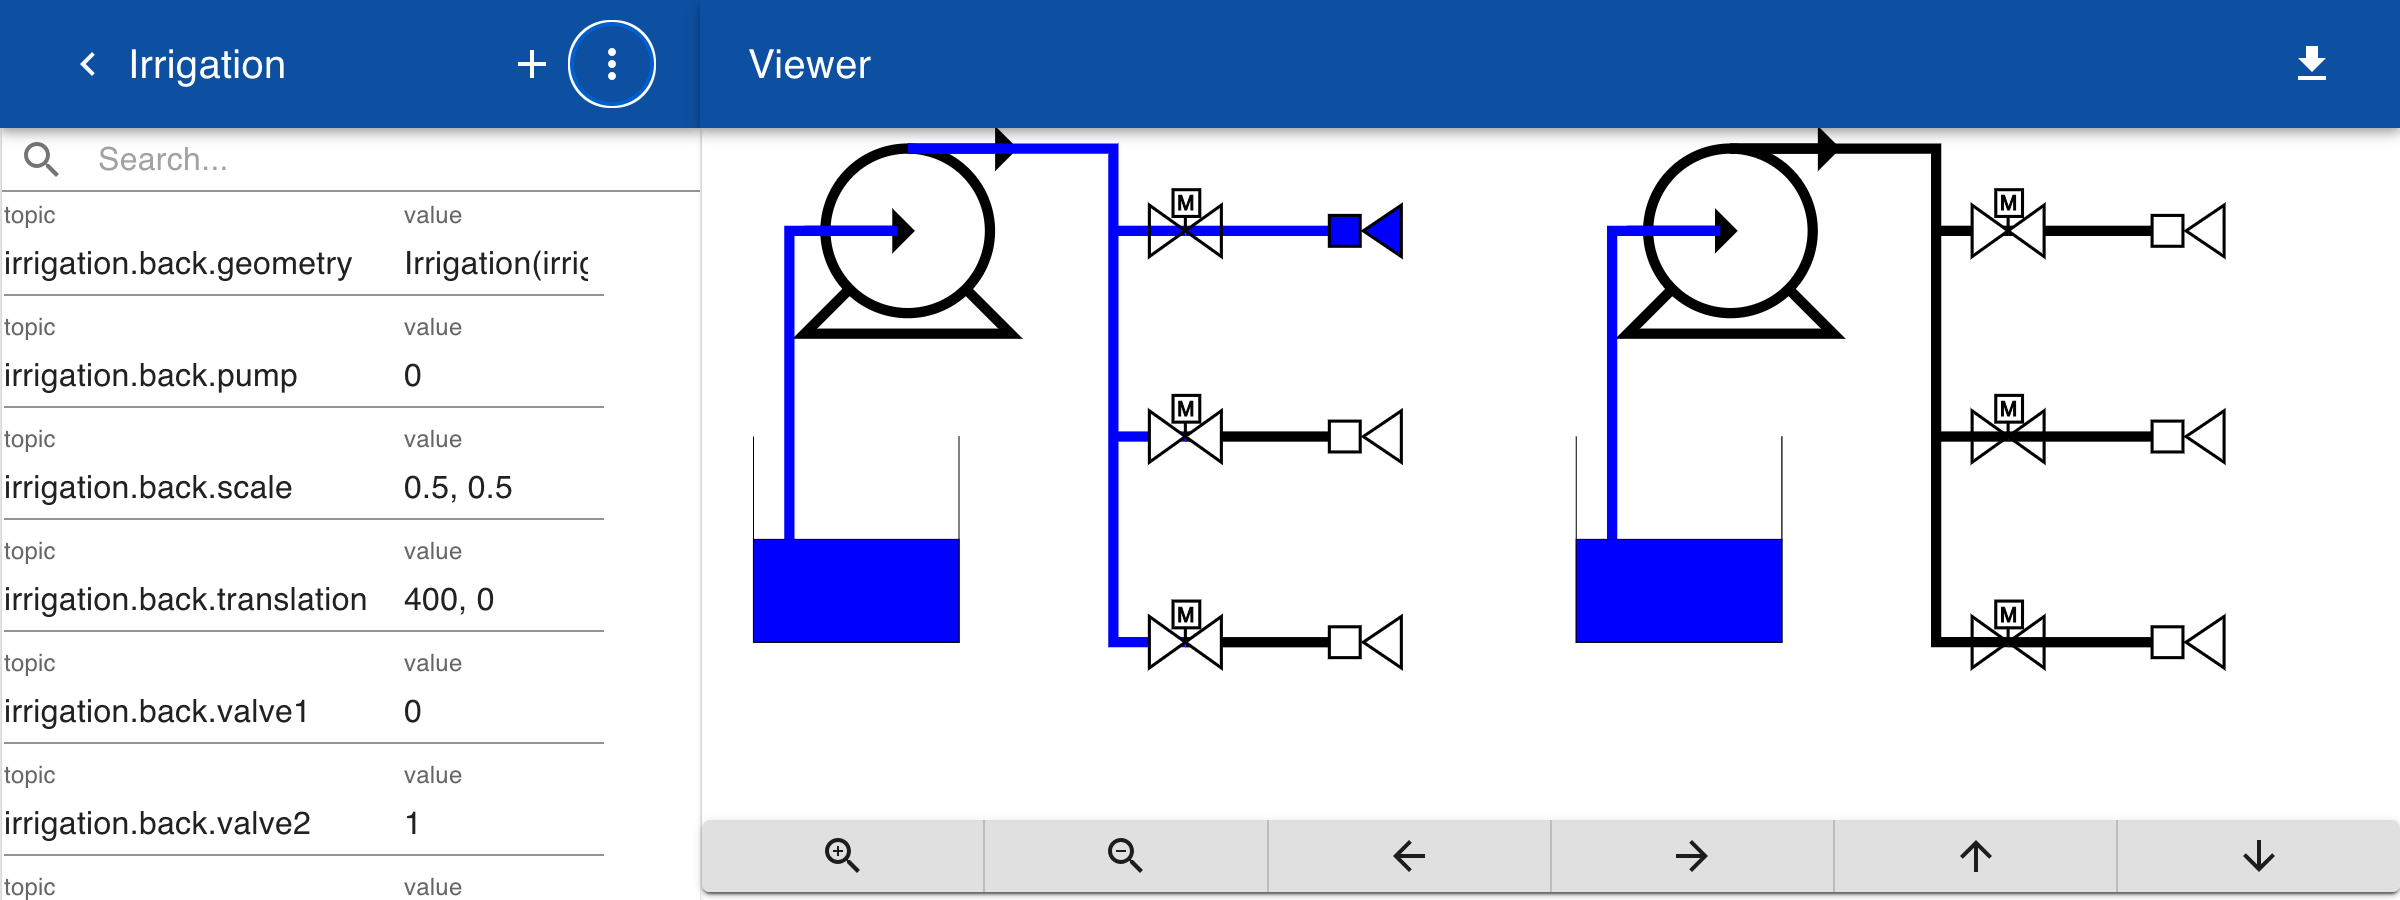
A second drawing with different values is shown below. The settings for the pumps and valves are different. The drawing is positioned 400 pixels to the right of the first drawing.
irrigation.back.geometry = Irrigation(irrigation.back)
irrigation.back.pump = 0
irrigation.back.valve1 = 1
irrigation.back.valve2 = 0
irrigation.back.valve3 = 0
irrigation.back.scale = 0.5, 0.5
irrigation.back.translation = 400,0
Diagram
From the navigation menu select the option Diagrams. Then click the button Add to create a new diagram. In the diagram click on the + button to add topics to display in the diagram. When you click on the pumps or valves in the diagram, the values of the related topics are updated. The diagram functions as a custom user interface component such as a date picker of slider.
MQTT
You can now check that MQTT messages are sent by starting an MQTT subscriber client in a terminal. After you click on a pump or a valve in the drawing, the new state is sent to the MQTT server. This can be used to control a physical pump or valve.
mosquitto_sub -h broker.hivemq.com -v -t spacetime/irrigation/#
spacetime/irrigation/back {valve2: 1}
spacetime/irrigation/back {valve3: 0}
spacetime/irrigation/front {pump: 1}
spacetime/irrigation/front {valve1: 1}