Floor plan
In this example we show how you can overlay an existing floor plan in SVG to show area properties such as temperature or humidity. In the 'Files' section import the file 'floorplan.svg' that shows the layout of an office.

Drawing
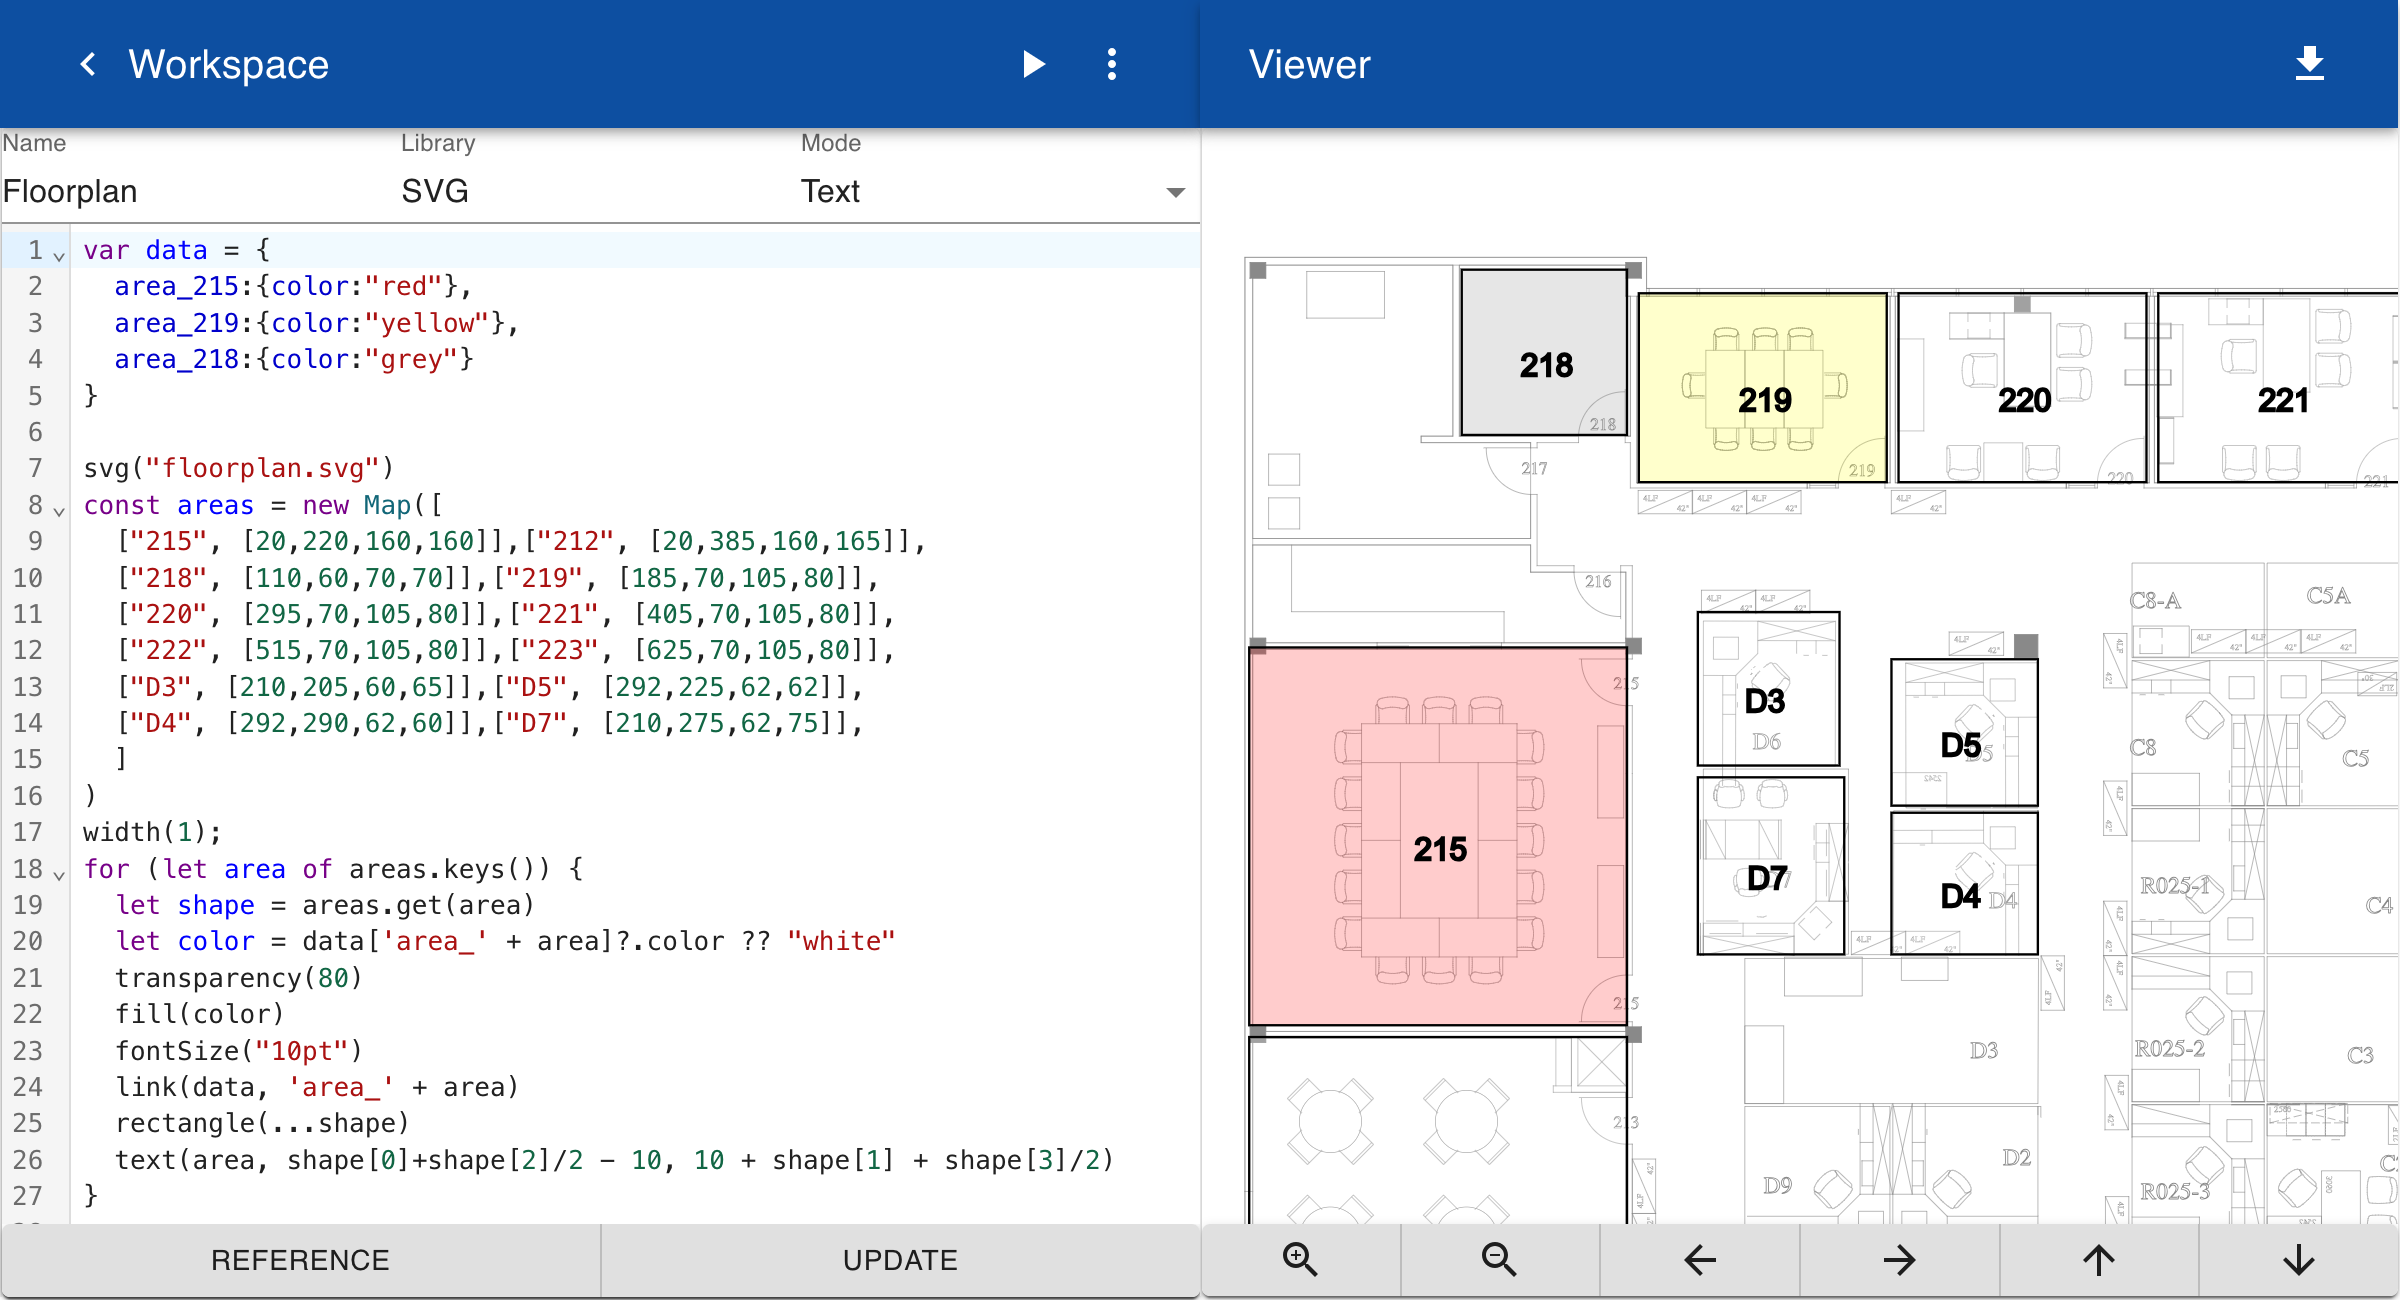
First we create a Drawing in text mode. The drawing includes a default variable data that contains the colors of all areas. The SVG for the floor plan is included in the drawing using the function svg(floorplan.svg). Next, a map of all areas is defined. The key in the map is the number of the area and the value is an array of 4 values that specify the x-position, y-position, width and height of the area. A for loop is used to draw all areas on top of the SVG of the floor plan. The fill color is defined by the color field defined in data variable. A link is defined so that a user can click on an area to open a form. The second parameter of the link is the name of the topic that should be opened in a form, for example area_212.
Form
In the 'Forms' module create a simple form Area that has fields for Occupancy, Temperature and Humidity. The temperature and humidity parameters are displayed by gauges with color ranges:
Area

Occupancy

Temperature
[0|15:blue,15|18:yellow,18|21:green,21|23:orange,23|30:red 00]

Humidity
[0|10:red,10|50:yellow,50|80:green,80|100:blue 00]
Topics
The main topic office.acme.floorplan has a subtopic geometry with a value that stores the name of the drawing and parameters to generate the drawing. There are subtopic for each area in the floor plan.
office.acme.floorplan.geometry = SVG.Floorplan(office.acme.floorplan)
office.acme.floorplan.area_212.occupancy = 1
office.acme.floorplan.area_212.temperature = 16
office.acme.floorplan.area_212.humidity = 87
office.acme.floorplan.area_213.occupancy = 1
office.acme.floorplan.area_213.temperature = 21
office.acme.floorplan.area_213.humidity = 88
...
When generating the drawing the topics are converted into a JavaScript object:
const office = {
    acme: {
        floorplan: {
            geometry: "SVG.Floorplan(office.acme.floorplan)"
            area_212: {
                occupancy: 1,
                temperature: 16,
                humidity: 87
            },
            area_213: {
                occupancy: 1,
                temperature: 21,
                humidity: 88
            }
            ...
        }
    }
}
This implies that the parameter office.acme.floorplan contains the information for all areas.
Diagram
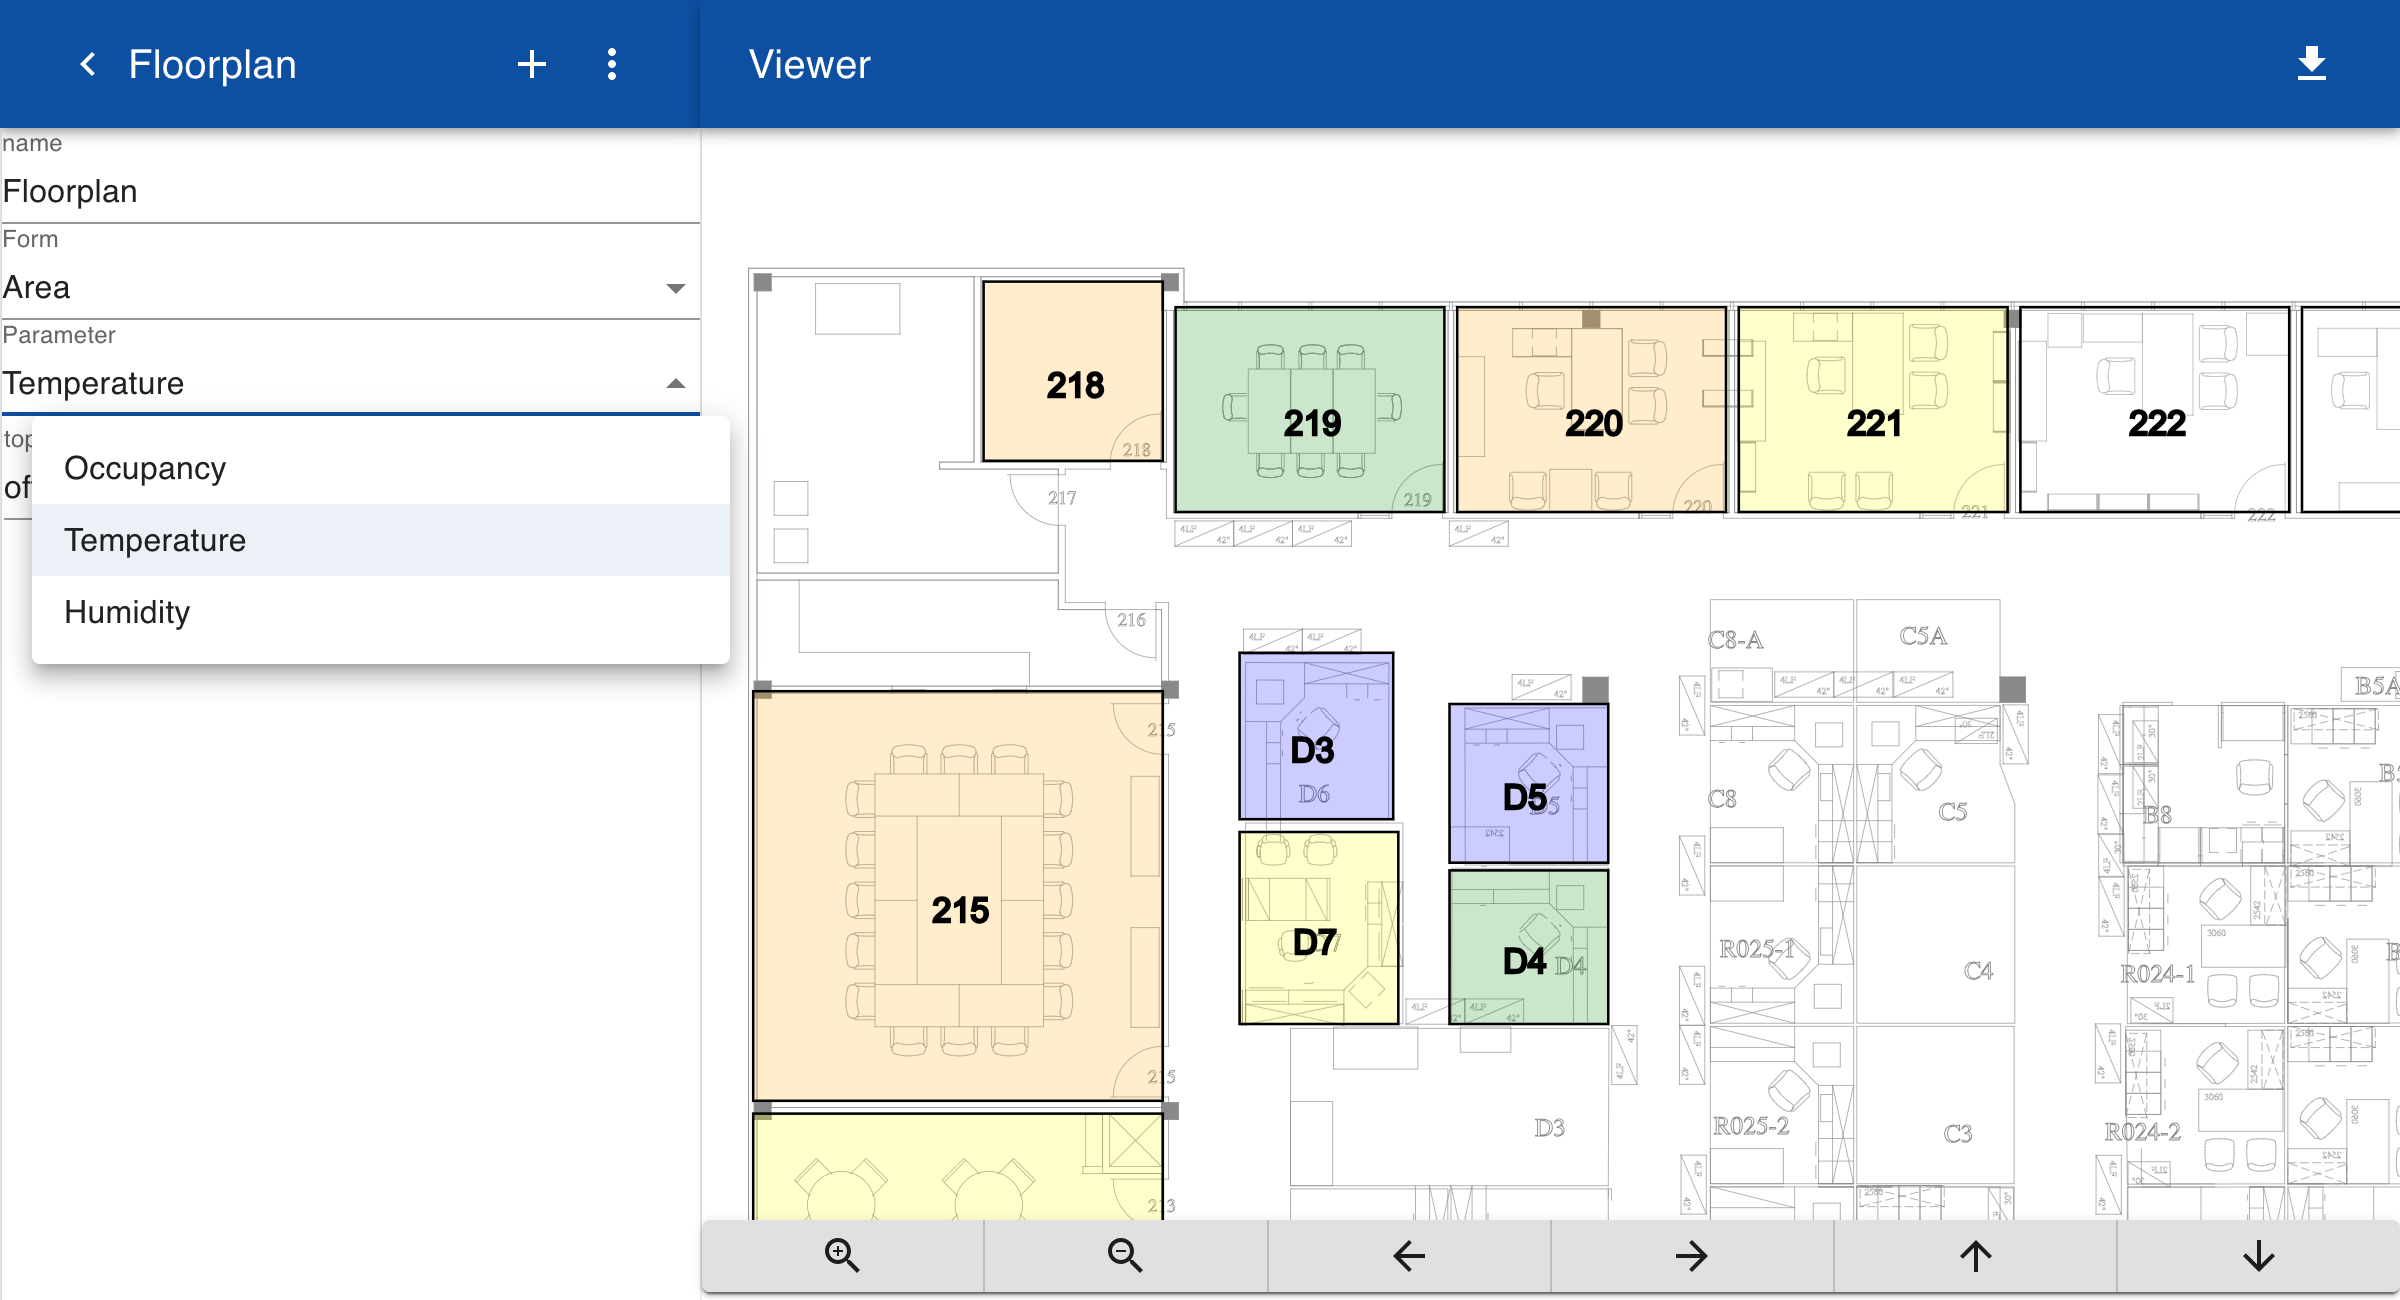
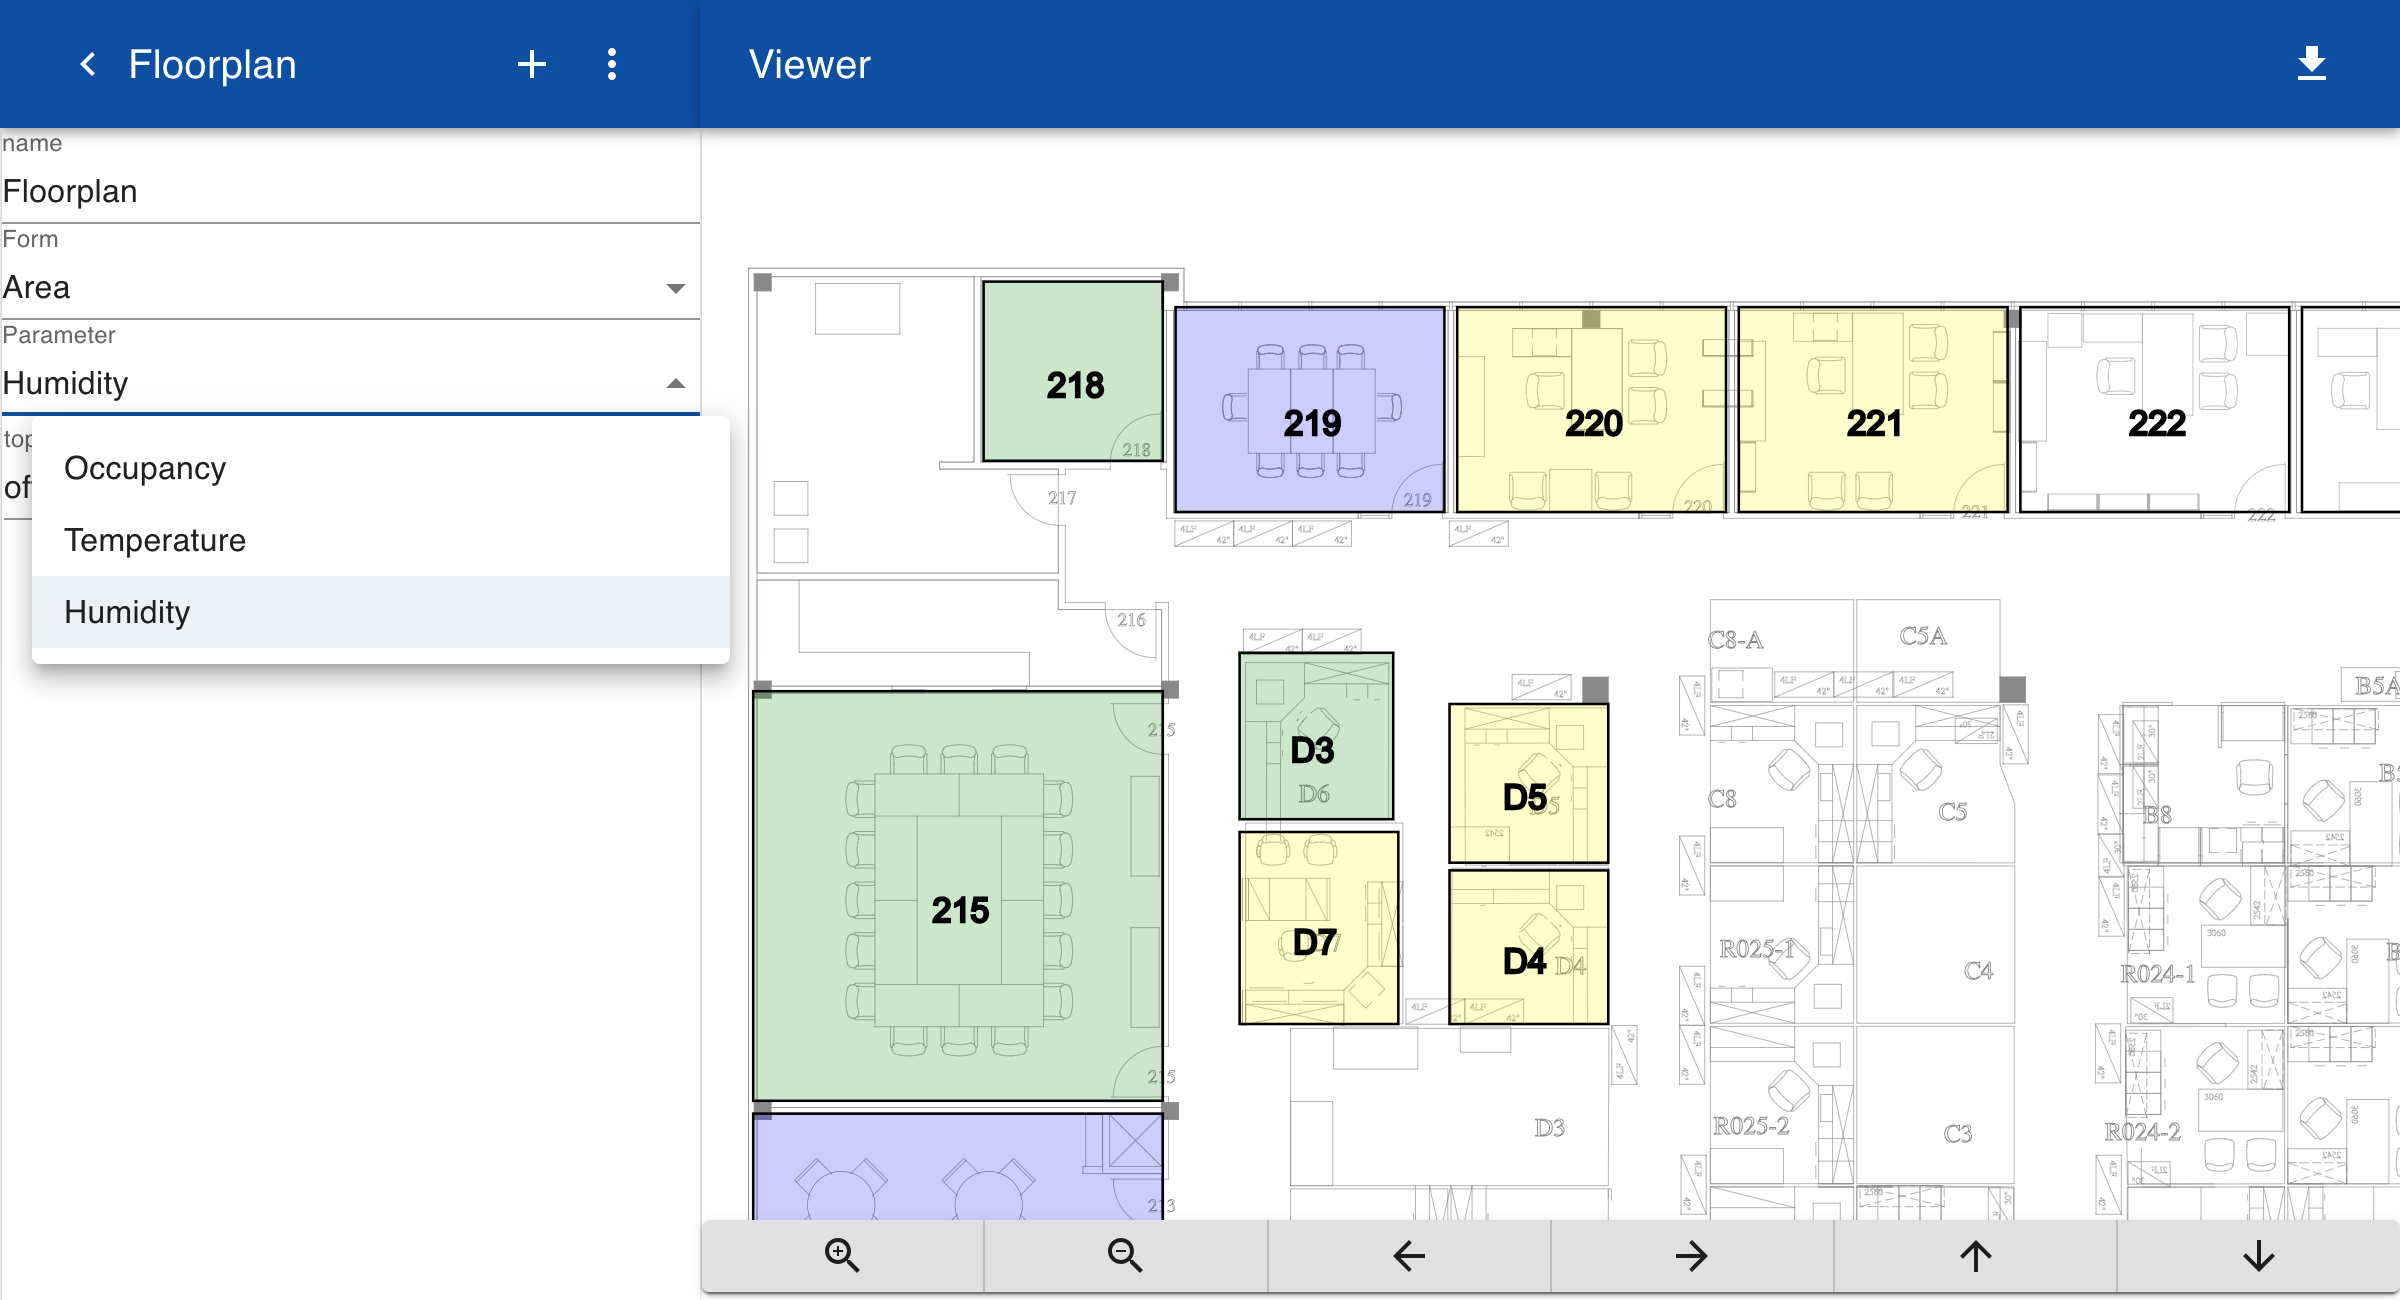
You can now create a new Diagram that links the topics to the Drawing. In the diagram you can specify the name of the form for displaying information about selected items. You can also select a parameter that should be used to recolor the areas in the drawing. In this example, we can switch the color scheme between temperature and humidity.
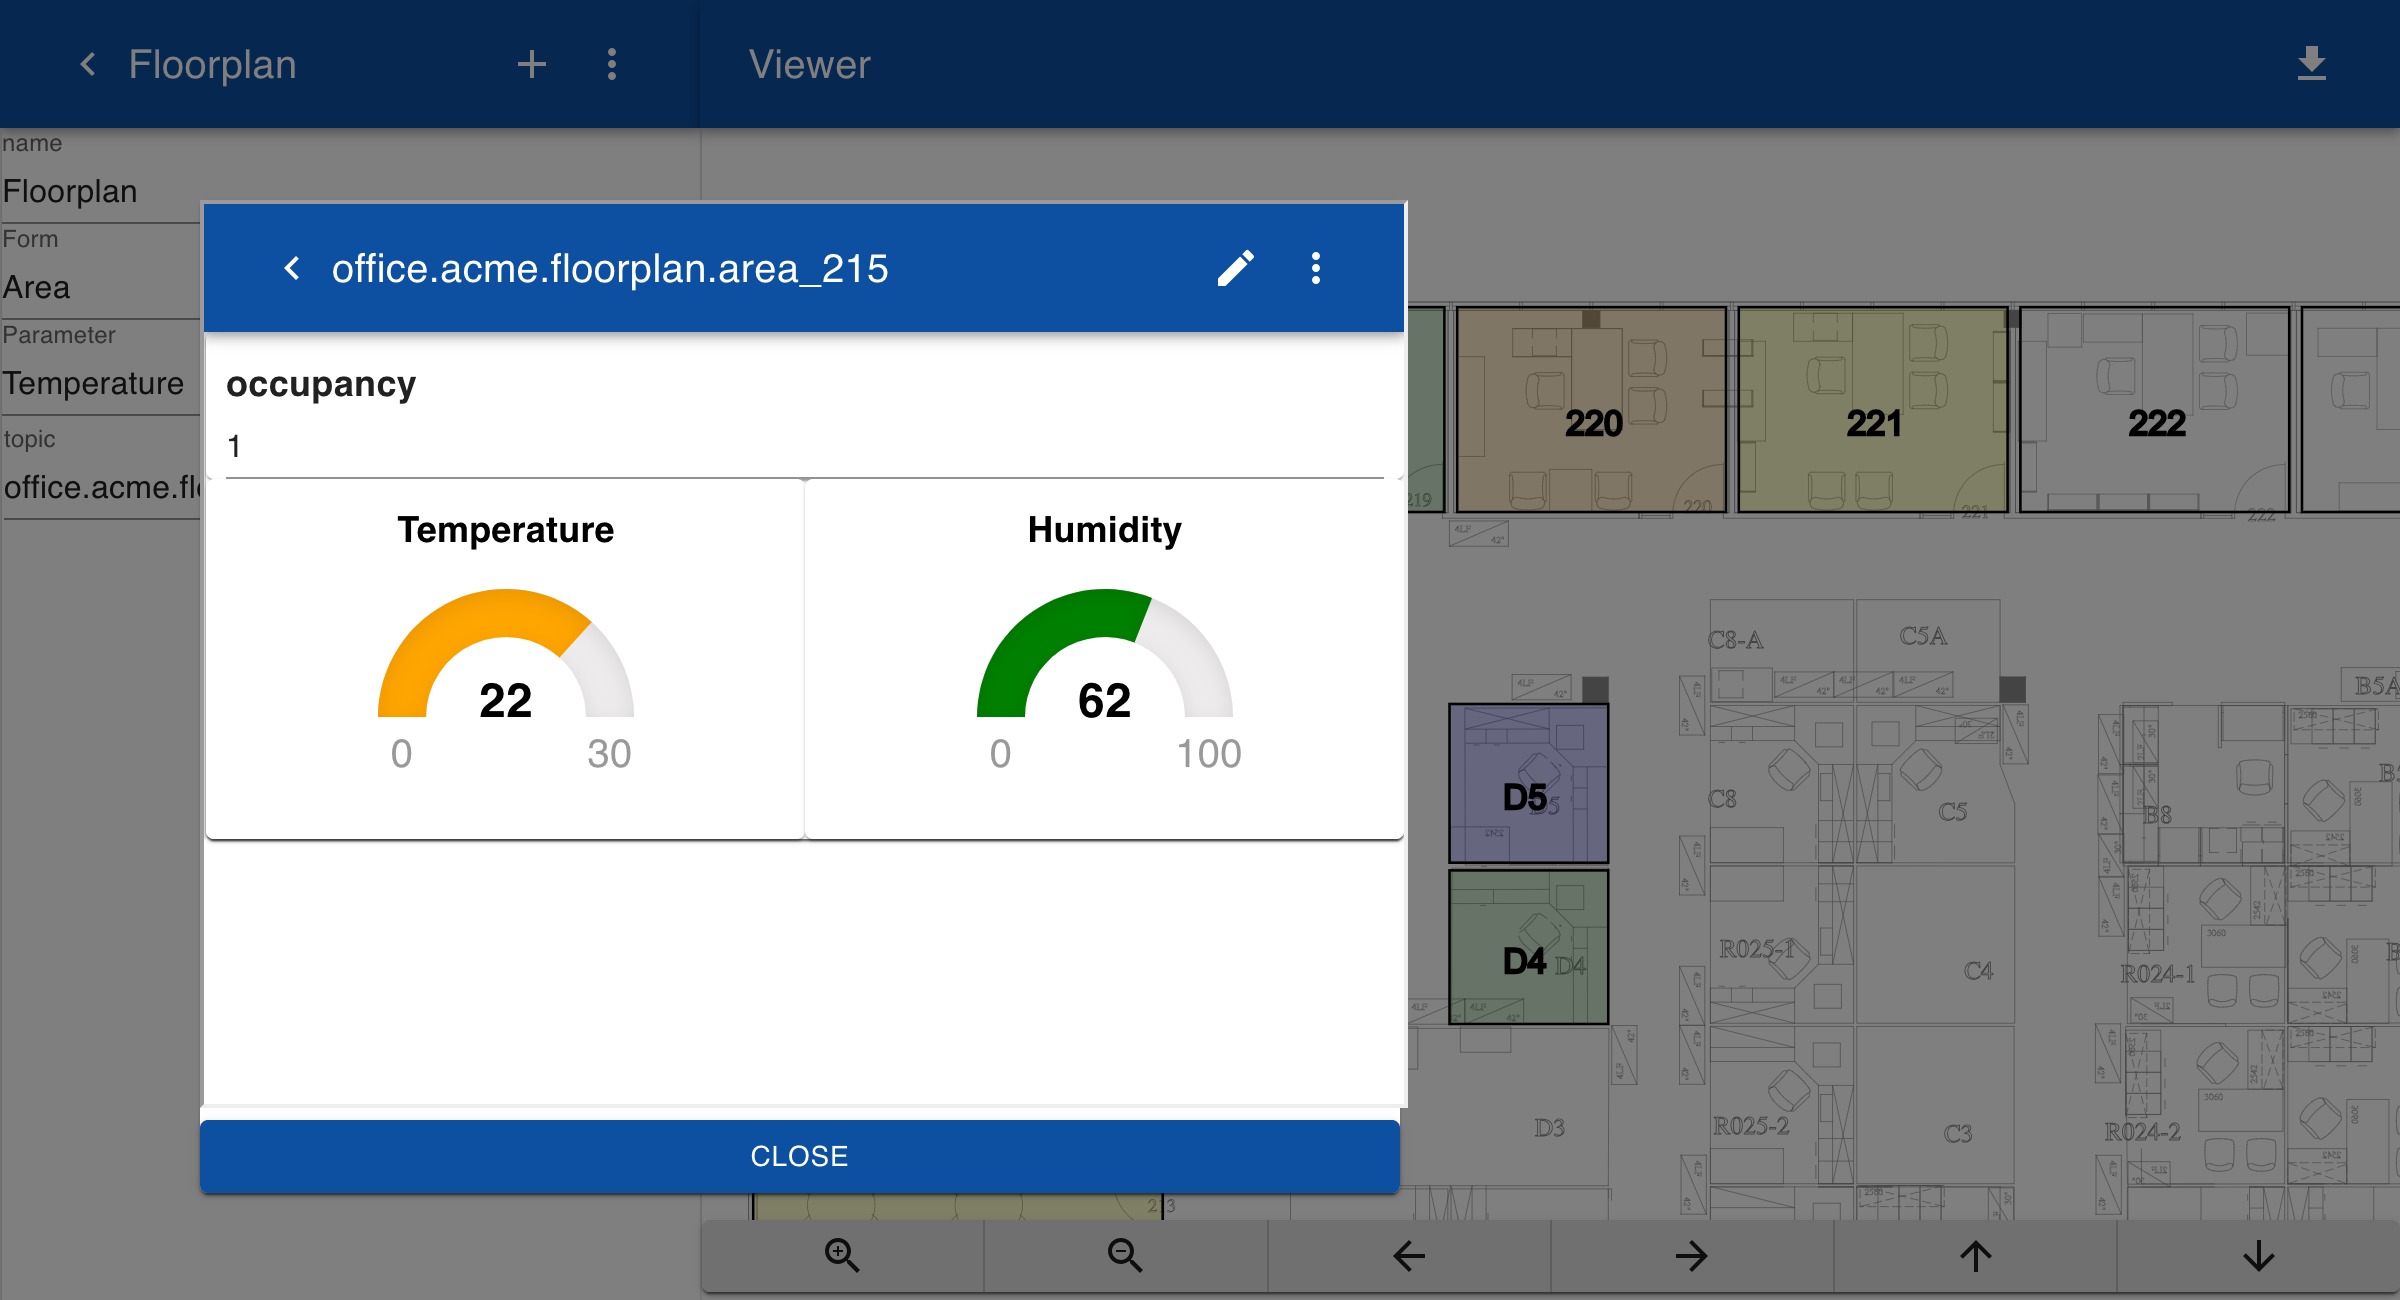
If you click on an item in the drawing, the form with details about the selected area is displayed. You can set the form in edit mode to update the values.