Links
In the previous sections we have shown how to create parametric SVG drawings that can reconfigure themselves based on IoT parameters. In this section we will show how to create interactive drawings that can reconfigure themselves based on user input by defining links in the drawing. When clicking on a link, the URL with the original parameters is replaced with the URL that has the new parameters. A visual feedback in the drawing is obtained by changing the color of the elements in the drawing depending on the parameters that are provided to the script via the URL.
Text
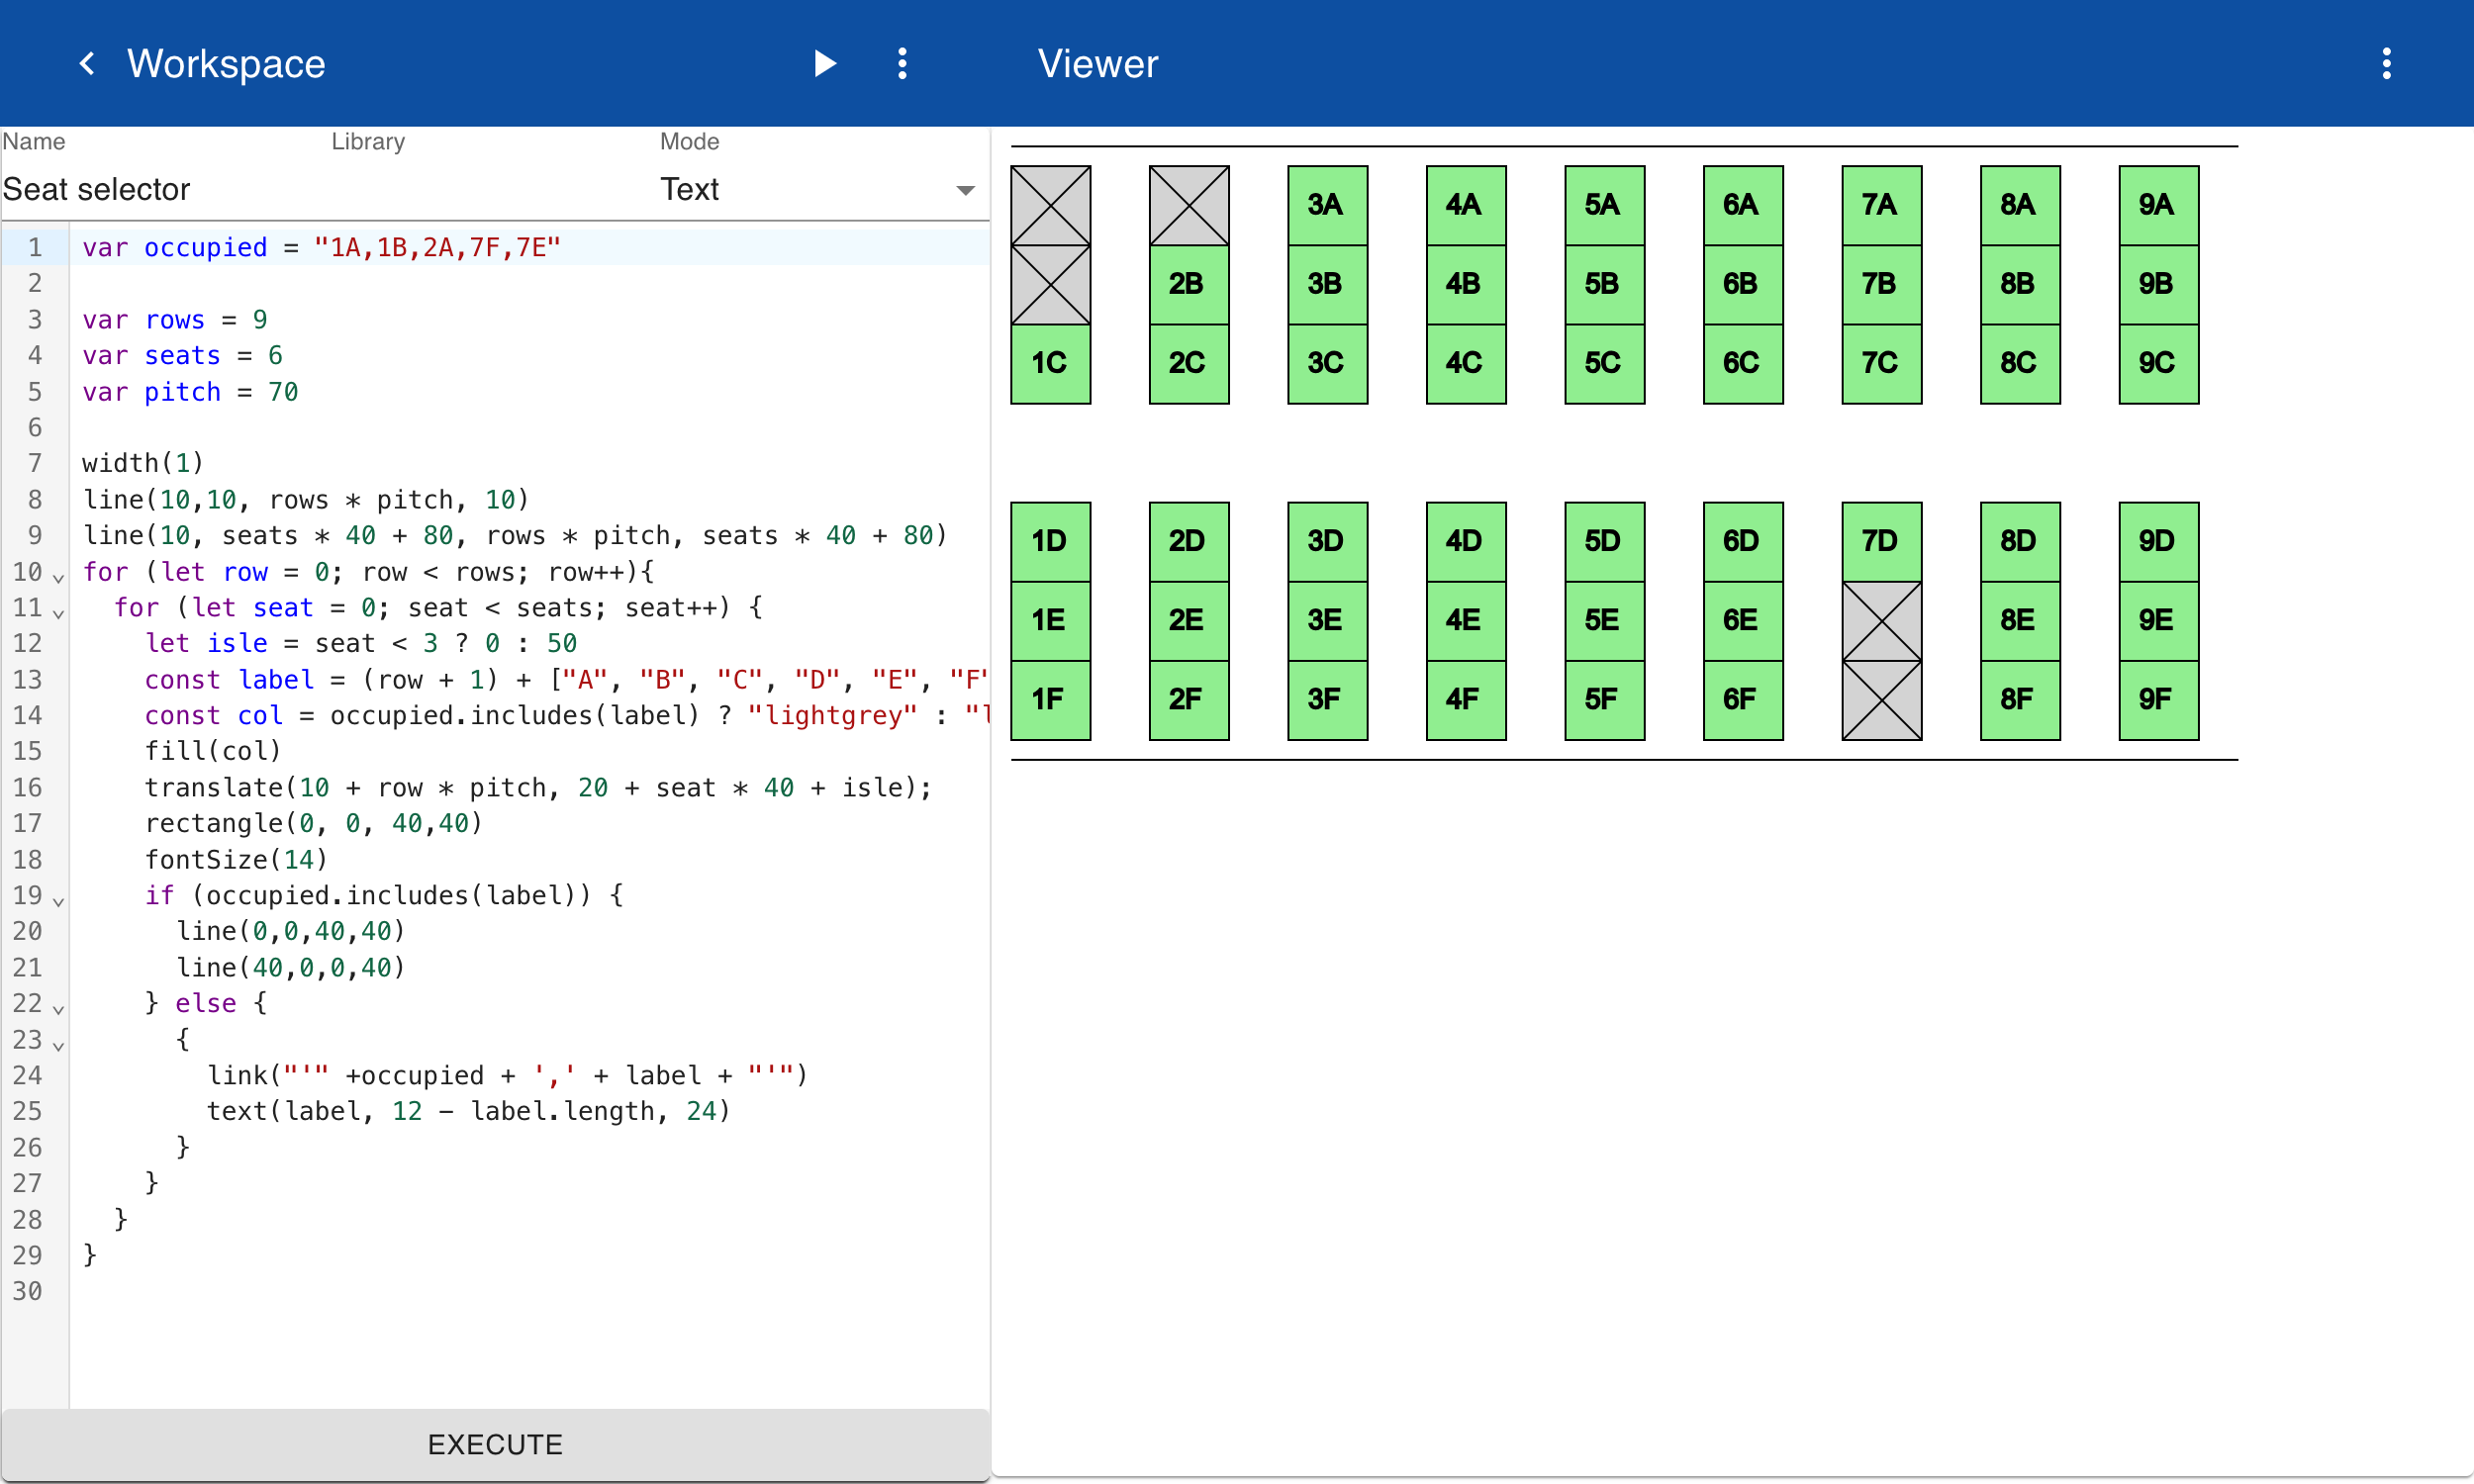
This example shows how to create a seat selector that updates itself after the user clicks on a seat. The state of the seat selector is stored in a variable called 'occupied'. This variable is a string of comma separated seat numbers. The seat numbers consist of a row number and a seat number (A-F). The seats are generated by two loops. Inside the loop the seat number (e.g. "3A") is generated. If the seat number is included in the variable 'occupied' the background color is changed to 'grey'. Otherwise, the background color is changed to 'light green'. If the seat number is not included in the variable 'occupied' a link is created that represents the new state of the variable 'occupied'. This is done by adding the seat number to the string 'occupied'.
link("'" + occupied + "', '" + label + "'")
For example, assume the current value of occupied to be1A, 1B, 2A, 7E, 7F. The argument to the link function for seat 6A will be as follows:
link('1A, 1B, 2A, 7E, 7F' + ', ' + '6A') // link('1A, 1B, 2A, 7E, 7F, 6A')
A link will be added to all subsequent SVG elements in the current block, in this case the text element. When the user clicks on the link the page is reloaded with the same URL and new state of the parameter for the Seat selector function:
<text onclick="window.location.href =`http://localhost:8010/drawing/svg/Seat selector('1A, 1B, 2A, 7E, 7F, 6A')`">6A</text>
The SVG is automatically generated based on the new value of the variable 'occupied' which now includes seat 6A. Because of the logic define in the script, the seat is now displayed in a grey color.
Object
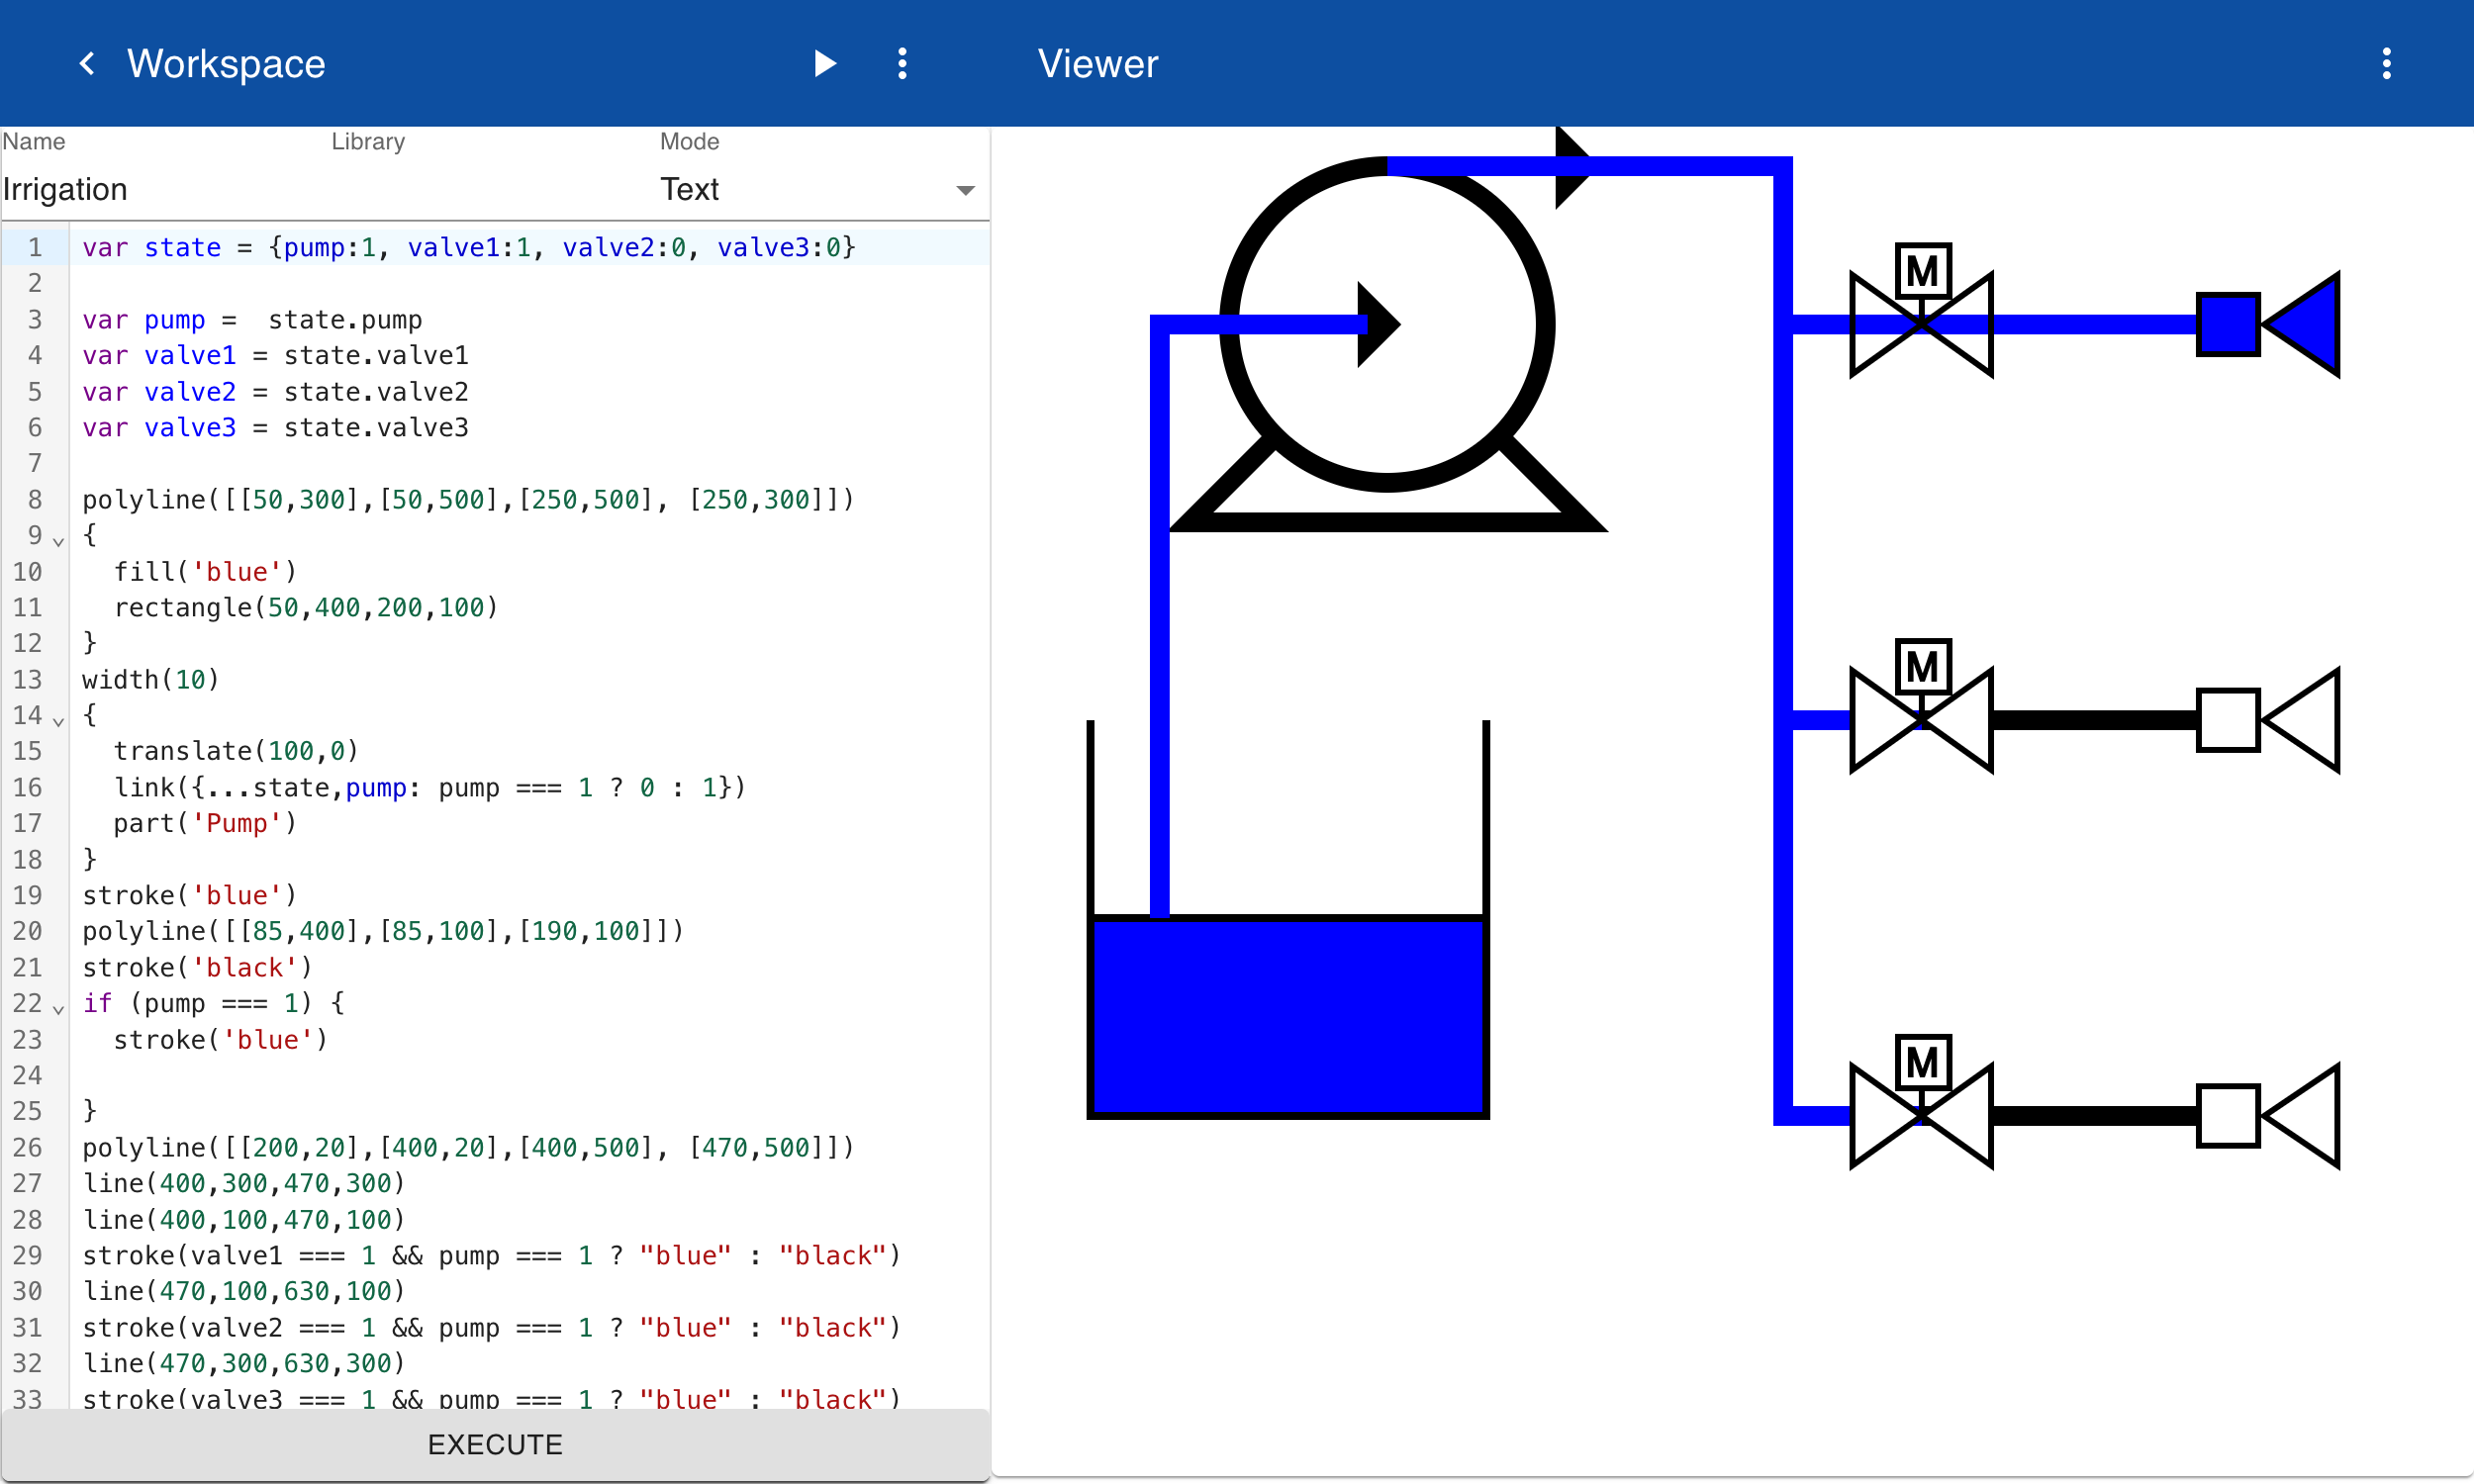
This example shows how to create an irrigation diagram that can be reconfigured based on user input. The state of the diagram is stored in the JavaScript object state. This is an object with fields for the value of the pump and three valves. In this example, the values 0 and 1 mean off or on for the pump and closed and open for the valves. Depending on the state of the pump, the line color to the three valves are blue or black. A link statement is used specify the new state of the user clicks on the part called Pump. In this example we use the JavaScript spread operator, which sets the new value of state by copying all fields from the current value using the ... operator. A ternary statement is used to toggle the value of the pump depending on the current value.
{
    translate(100,10)
    link({...state, pump: pump === 1 ? 0 : 1})
    part("Pump")
}
When a link function is called, the link is added to all geometry that is created next, in this case it is added to all elements in the part. To cancel adding links you can either call the function again with an empty value link("") or enter the link statement inside a block statement as shown above. Like with other settings such as fill and color, the link is only applied to elements created in the block statement. In the example below the first valve is set to 1 or open and the other two valves are closed. Then the user clicks on the second and third valve their status is toggled. The SVG is automatically updated to reflect the new value of state by showing the flow of water as blue lines. When the user clicks on the pump, the pump is shut off and the water flow is stopped.
When the design of the drawing is complete, you can embed the SVG in a web page using an <img> tag. You can open the URL directly in a web browser with an optional parameter that defines the initial state.
http://localhost:8010/drawings/svg/Irrigation({pump:0,valve1:1})