Text Mode
In Text Mode you can create a drawing by entering statements in JavaScript instead of dragging blocks from a visual workspace. You can use the full functionality of modern JavaScript including maps, arrow functions and regular expressions. The text mode makes is easy to cut and paste code from other drawings and to use JavaScript functionality that is not supported in the Visual Mode.
Elements
The following functions are used to create new geometry. When a function is called, a new element is created with the default settings for color, line width and fill.
Line
Draw a line from x1,y1 to x2,y2. The width of the line is set via the width function and the color is set with the stoke function.
line(x1, y1, x2, y2)
Rectangle
Draw a rectangle at position x, y with dimensions width and height and an optional parameter to set the radius for rounding the corners. The width of the border is set via the width function and the border color is set with the stoke function. The color of the inside is set with fill.
rectangle(x, y, width, height, r = 0)
Circle
Draw a circle at position x,y with a radius r.
The width of the border is set via the width function and the border color is set with the stoke function. The color of the inside is set with fill.
circle(x, y, r)
Arc
Draw an arc at position x,y with a radius r and an angle startAngle and endAngle.
The width of the border is set via the width function and the border color is set with the stoke function. The color of the inside is set with fill.
arc(x, y, r, startAngle, endAngle)
Text
Draw a text defined by the parameter text, with an optional parameter to set the 'x' and 'y' position, and an optional parameter to set the angle 'a'. The font size is set via the fontSize function and the color is set with the stoke function.
text(text, x = 0, y = 0, a = 0)
Polygon
Draw a polygon defined by the parameter points, where each point is an array of two numbers [x, y]. The width of the border is set via the width function and the border color is set with the stoke function. The color of the inside is set with fill.
polygon(points[][])
Polyline
Draw a polyline defined by the parameter points, where each point is an array of two numbers [x, y]. The width of the border is set via the width function and the border color is set with the stoke function.
polyline(points[][])
Part
Include a drawing from another library. The name parameter is the name of the part, optionally preceded by the name of the library, separated by a dot. For example, library.part or mylib.mylib.part. The parameters can be used to pass parameters to the drawing.
part(name, parameters...)
Modifiers
Modifiers can be used to change the properties of the next drawing operation. When a modifier is used inside a function or block it only applies to the drawing operations in the function or block.
Stoke
Set the border color of the next drawing operation. The color can be defined with a hex string such as '#900000'or a named color like 'dark red'.
stoke(color)
Fill
Set the fill color of the next drawing operation. The color can be defined with a hex string such as '#900000'or a named color like 'dark red'.
fill(color)
Fonts size
Set the size of the font for the next drawing operation. If not defined the default font size is 20 pixels. If the size is a number it is interpreted as pixels, if it is a string it is interpreted as a CSS size such as '12px' or '12pt'.
fontSize(size)
Link
Add a link to subsequent SVG elements. The parameters field is the value of the new parameters for rendering the drawing after the user has clicked on the element. The topic field is the name of the subtopic that is linked to this element. This can be used to open forms with input fields or documents.
link(parameters, topic)
Transformations
Translate
Move the origin of the next drawing operation to the position x, y.
translate(x, y)
Rotate
Rotate the origin of the next drawing operation by the angle a. Optionally specify the rotation center x, y.
rotate(a, x, y)
Scale
Scale the origin of the next drawing operation by x, y.
scale(x, y)
Clip
Set a clipping region for the next drawing operation. The clipping region is defined by a rectangle with position x, y and dimensions width and height. To reset the clipping region use the clip function without arguments.
clip(x, y, width, height)
Examples
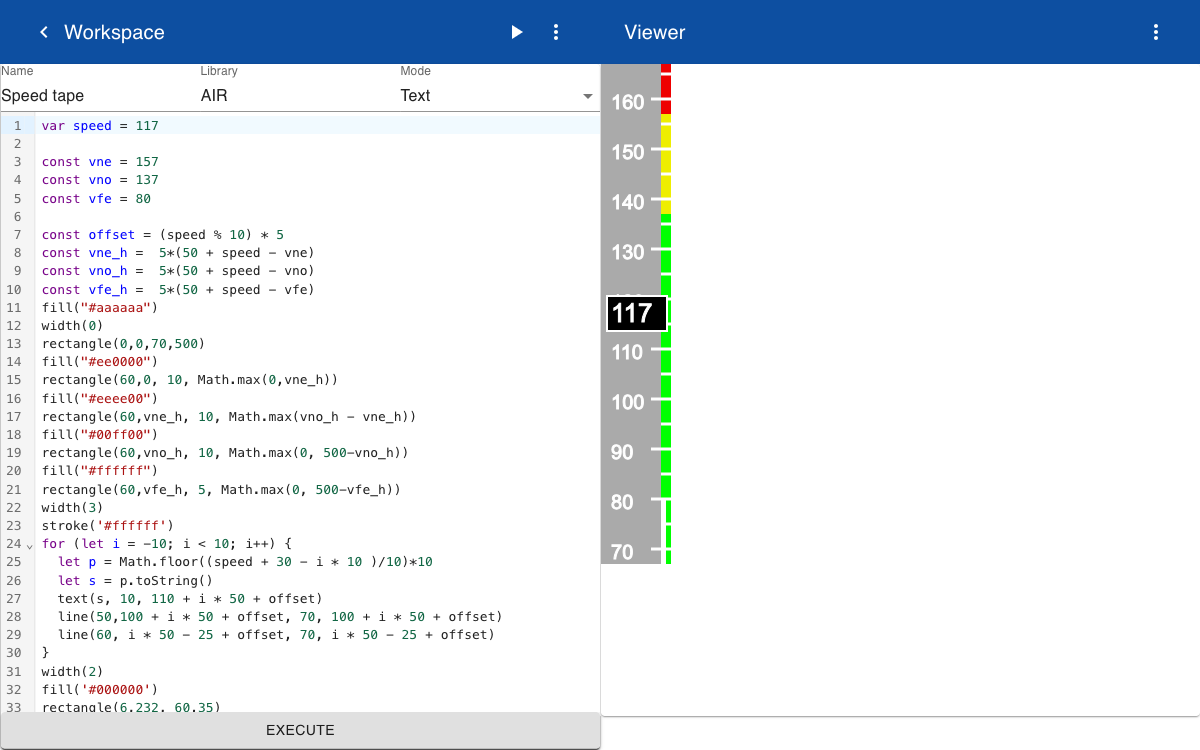
The drawing below shows some examples of how to use the text mode for creating a speed tape in an aircraft. The speed tape diagram shows the current speed in a black box. The speed slider moves vertically below the box and has regions for showing the speed ranges for normal operation (green), warning (yellow) and excess speed (red). A JavaScript for statement is used to create the moving tape with speed markers and number labels. The drawing has a variable speed with a default value of `117' that can be overridden by a user define parameter as shown in the earlier example of the compass.
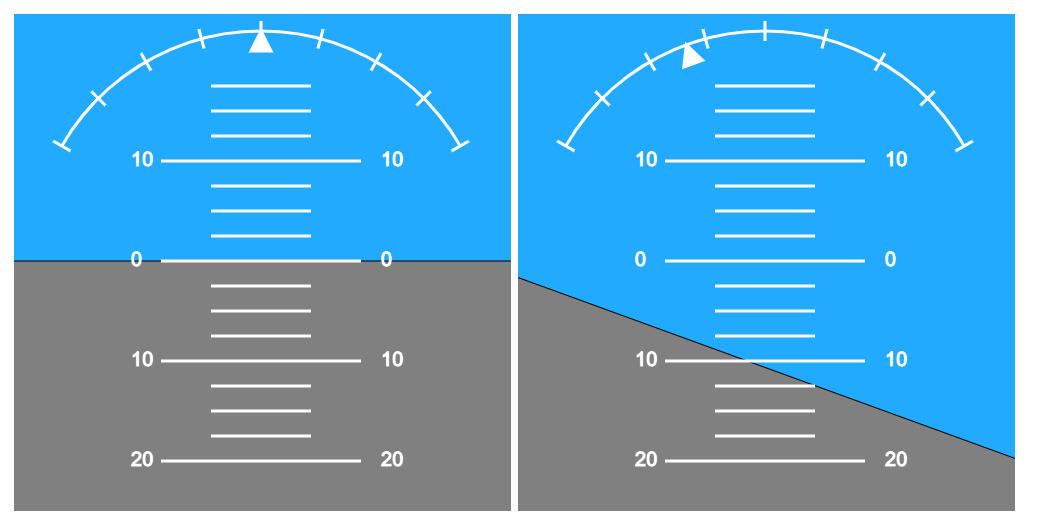
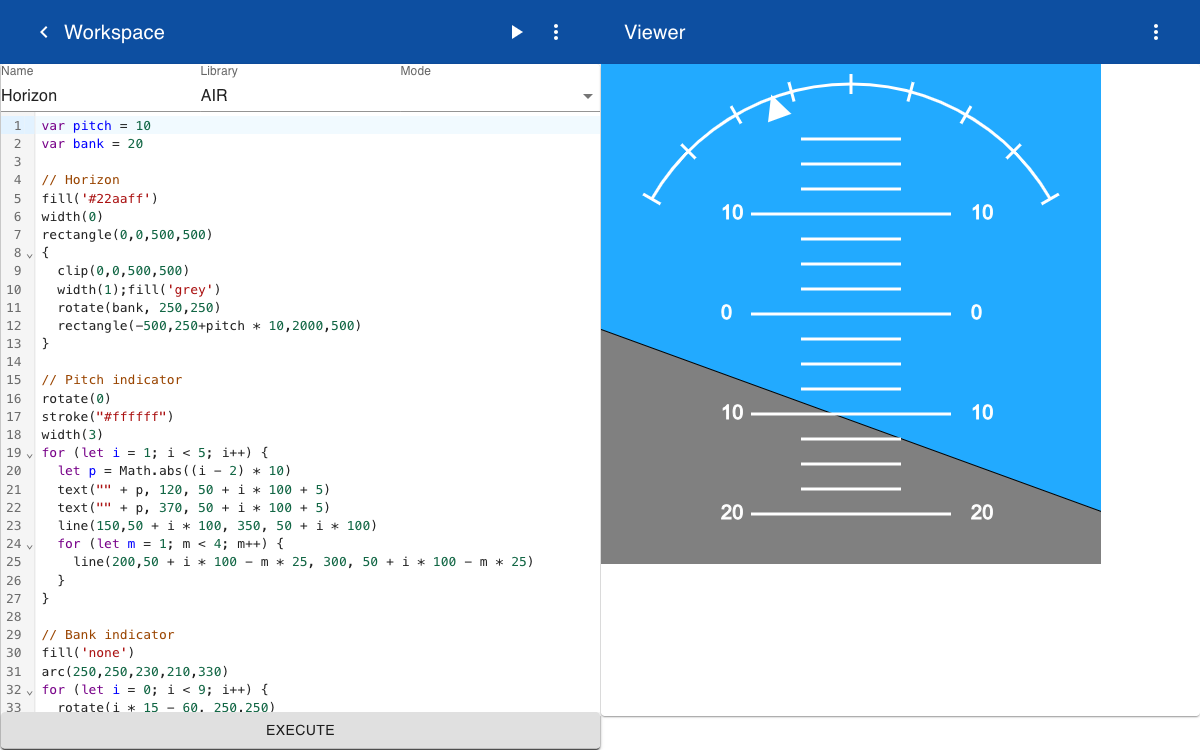
The next example shows an artificial horizon with the terrain in grey and sky in blue. The drawing has two parameters that define the pitch and bank (or roll) of the aircraft. The display is created by a blue rectangle that covers an area of 500 x 500 pixels. The terrain is drawn inside a block statement. A grey rectangle is positioned so that it matches the pitch parameter and rotated to match the bank parameter. The grey rectangle is clipped to the size of the blue rectangle.
SVG
The text mode editor shows the generated SVG drawing in a viewer window. The SVG can also be called from a web page. The following example shows how to call the SVG from a web page with different parameters for the pitch and bank parameters. Note that the drawing was named Horizon and the library was set to AIR. To generate the SVG you enter the name of the library, followed by a dot and the name of the drawing. The parameters are passed as a string in the URL. The URL is called from the HTML page below.
<html>

<body>
    <table>
        <tr >
            <td >
                <img src="http://localhost:8010/drawings/svg/AIR.Horizon(0, 0)" width="500" height="500">
            </td>
            <td>
                <img src="http://localhost:8010/drawings/svg/AIR.Horizon(10,20)" width="500" height="500">
            </td>
        </tr>
    </table>
</body>

</html>
When the HTML page is opened in a web browser it shows the two SVG drawings with different parameters for the pitch and bank angle.