Forecasting
In the previous example we have shown how you can forecast a value based on the value of other topics. Another way of forecasting is by interpolation of historical values. This can be done via regression or a neural network.
Regression
In this example we show the data of the number of infections. The actual data is shown by selecting Now as the end date.
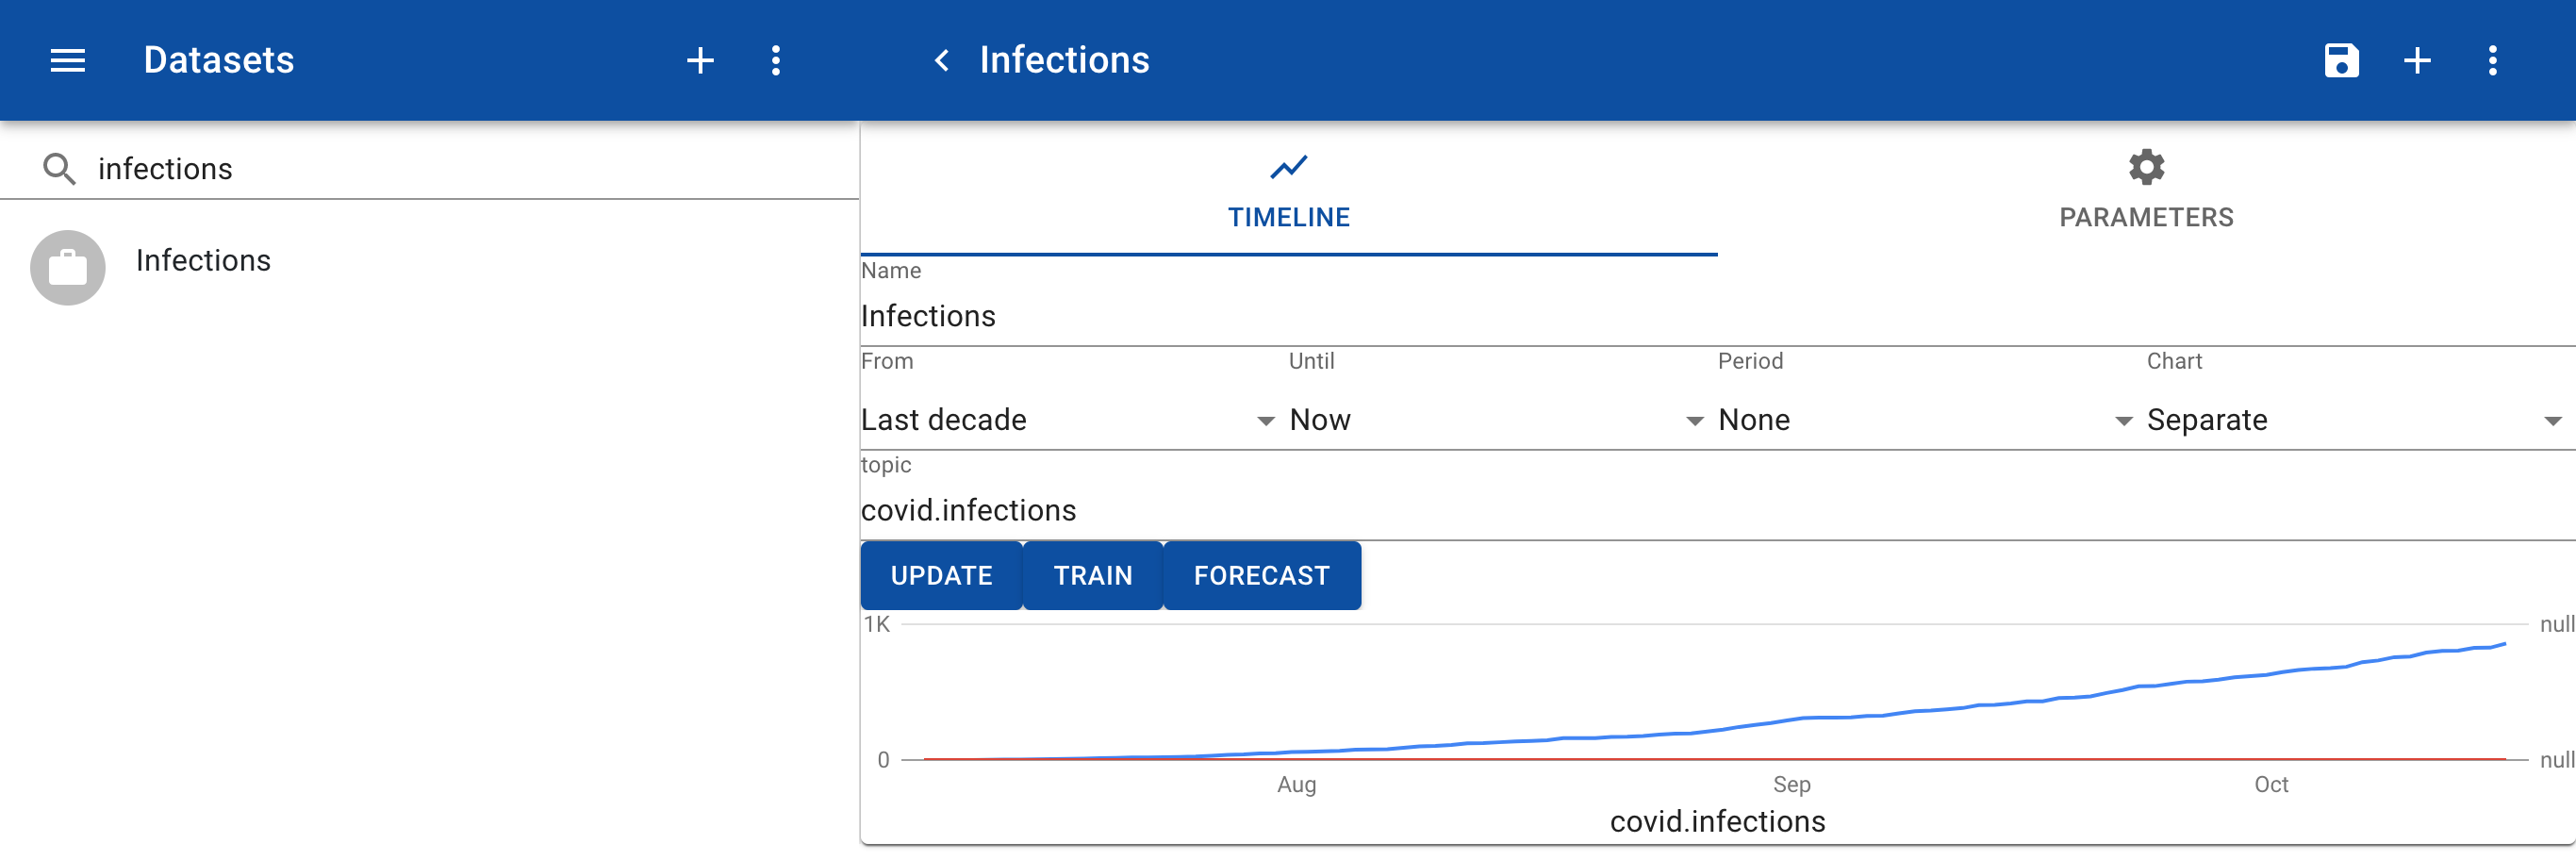
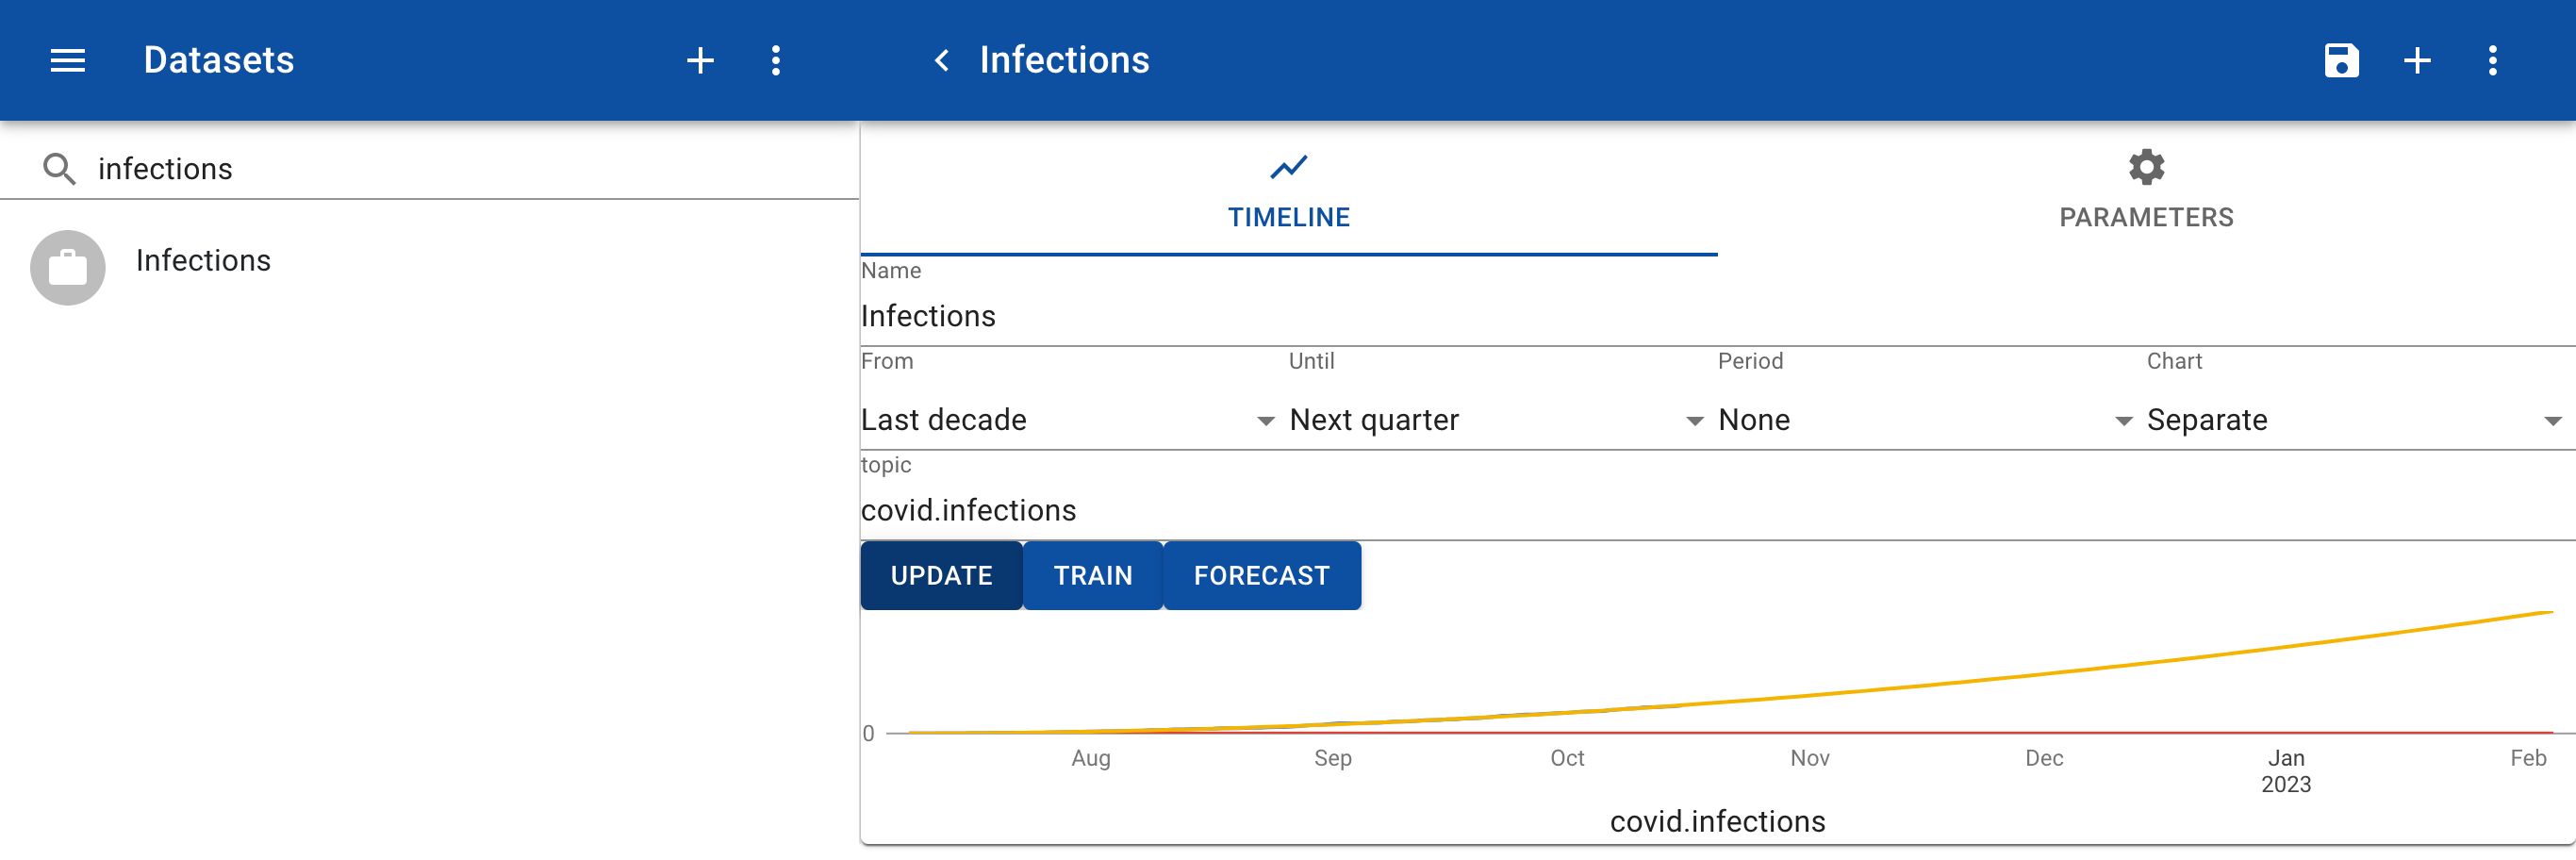
If we change the Until from Now to Next quarter we see the prediction based on so-called polynomial interpolation. This is done by trying to fit a line, parabola or third-order polynomial function.
Neural network
More advanced forecasting can be obtained by using the neural network capacilities, often referred to as machine learning. This forecasting can also take into account cycles. The blue line shows the actual data of a CPU load of a server. We see that there is a daily cycle with peaks around 10.00 and a weekly cycle where load is lower on saturday and sunday.
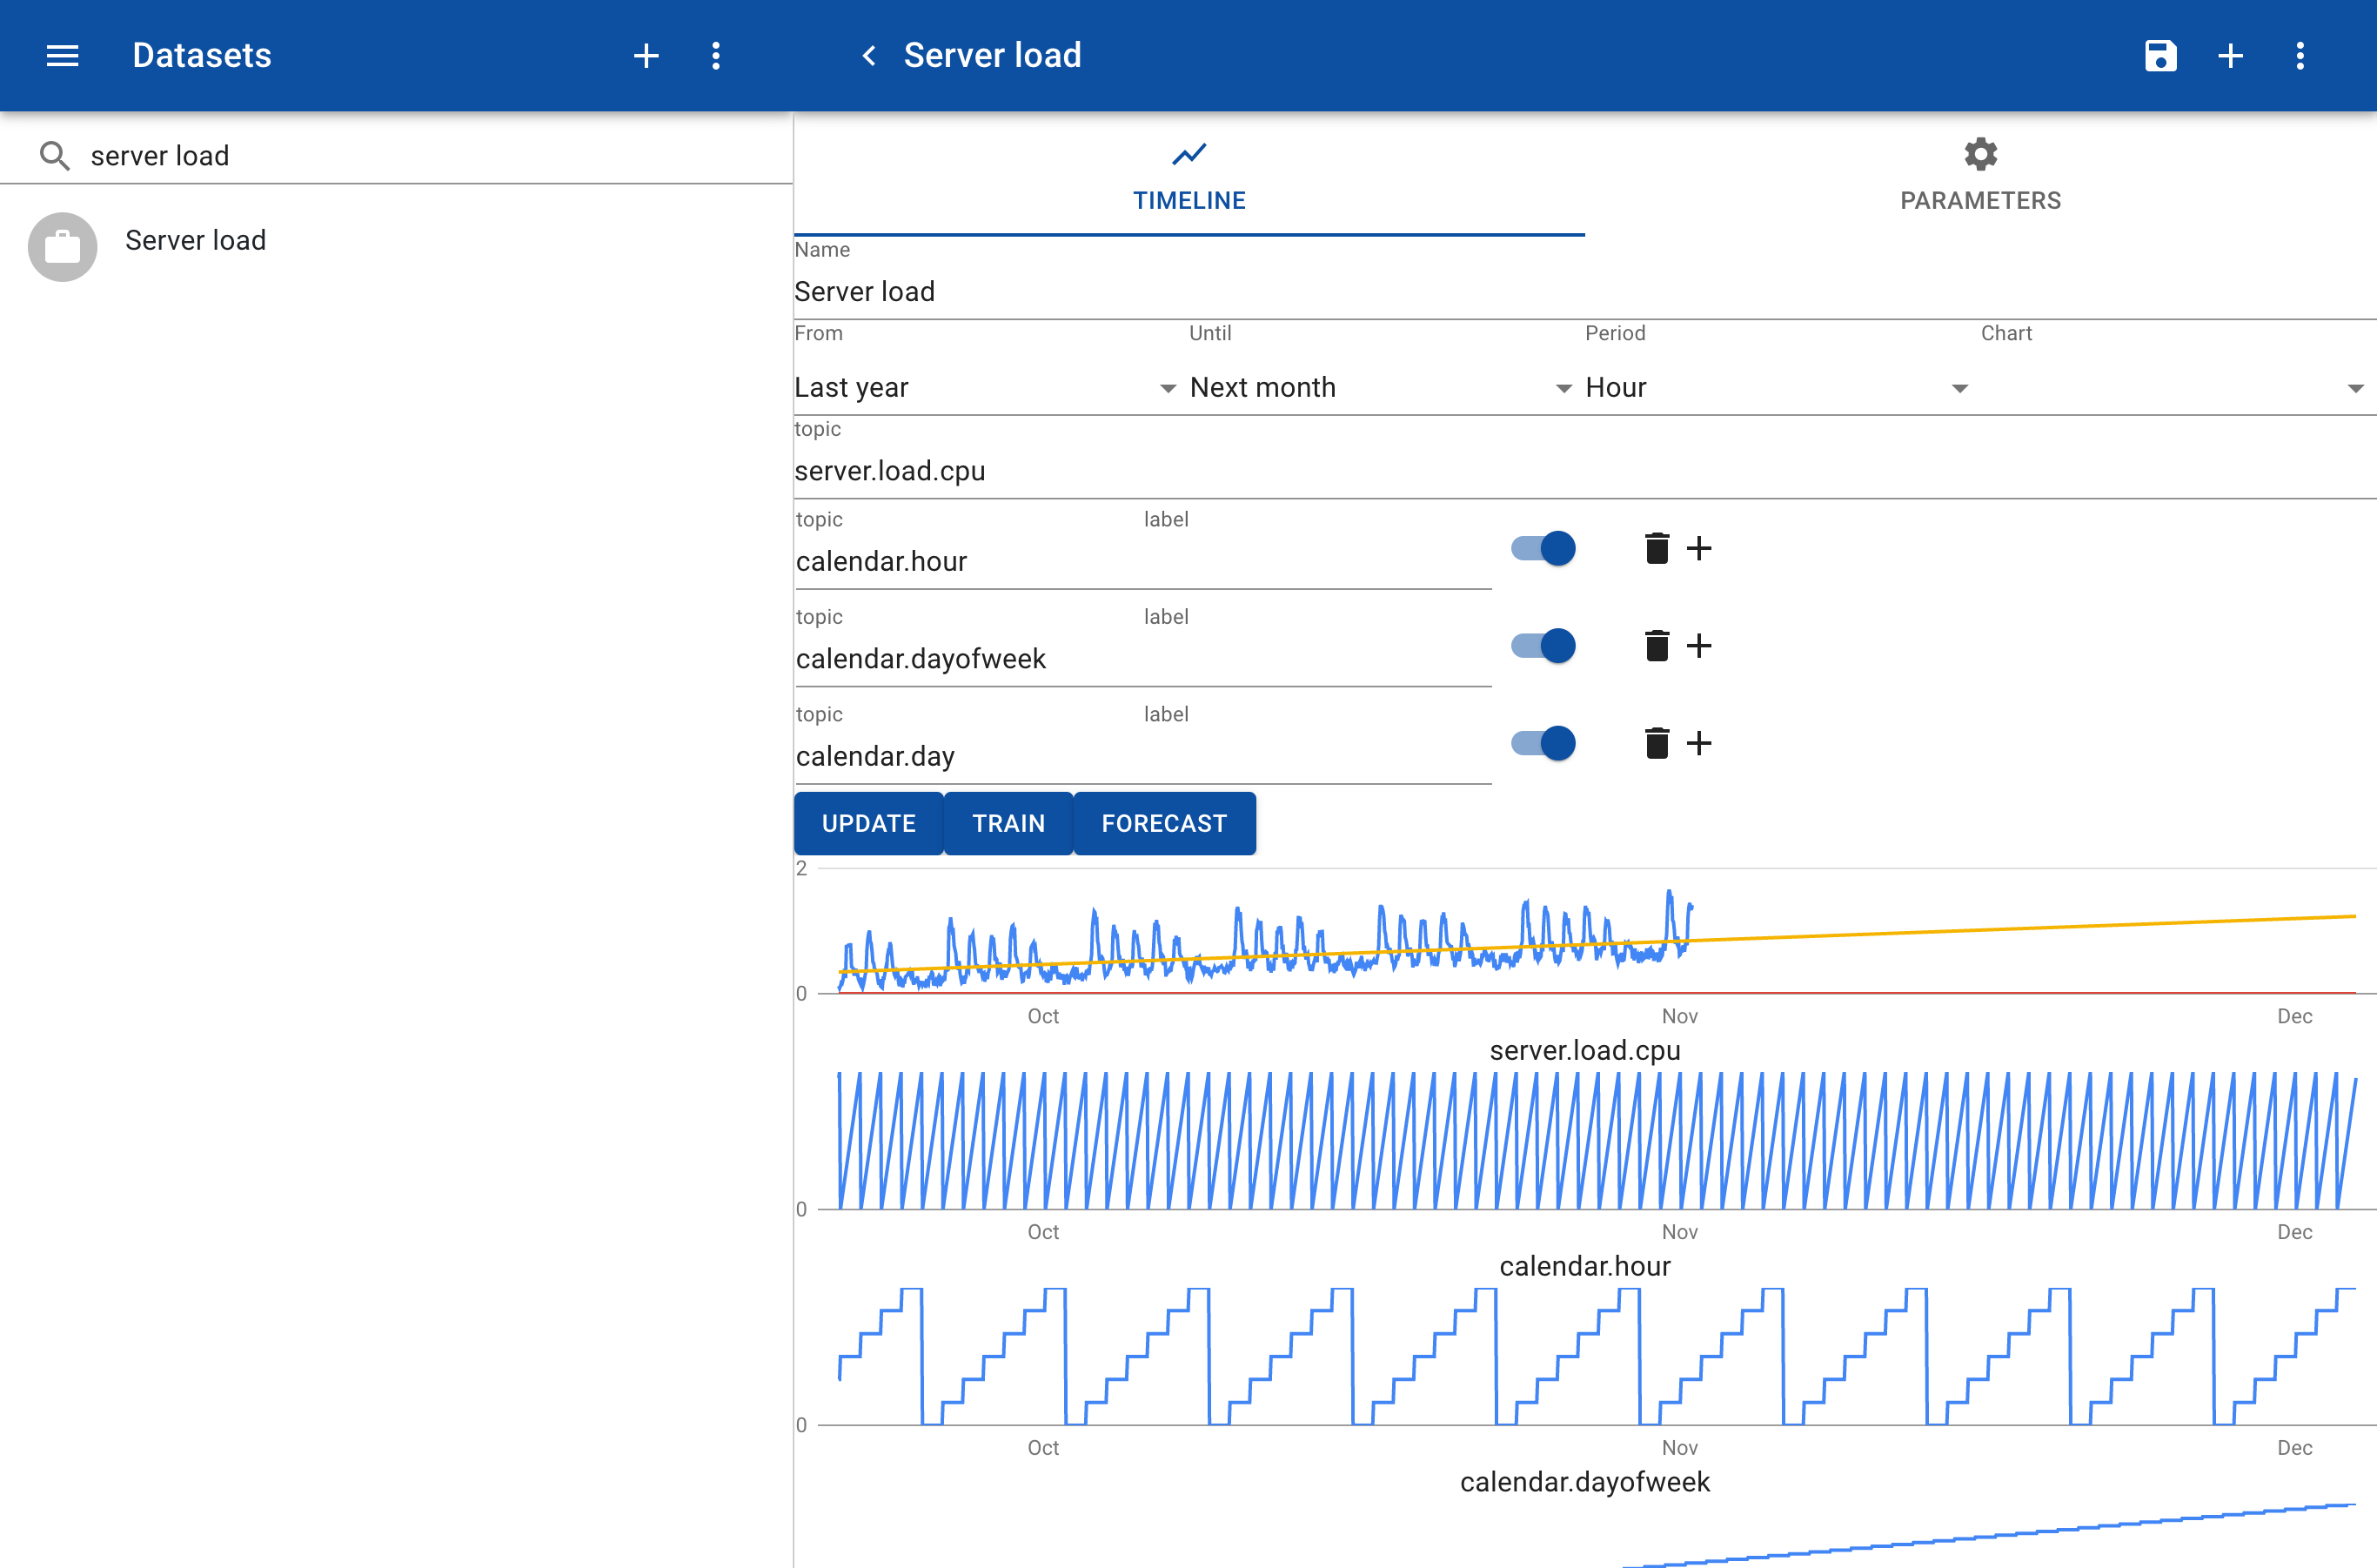
When you add an input calendar.hour this will be used as an input for the forecast. The red line shows that it has detected the daily pattern.
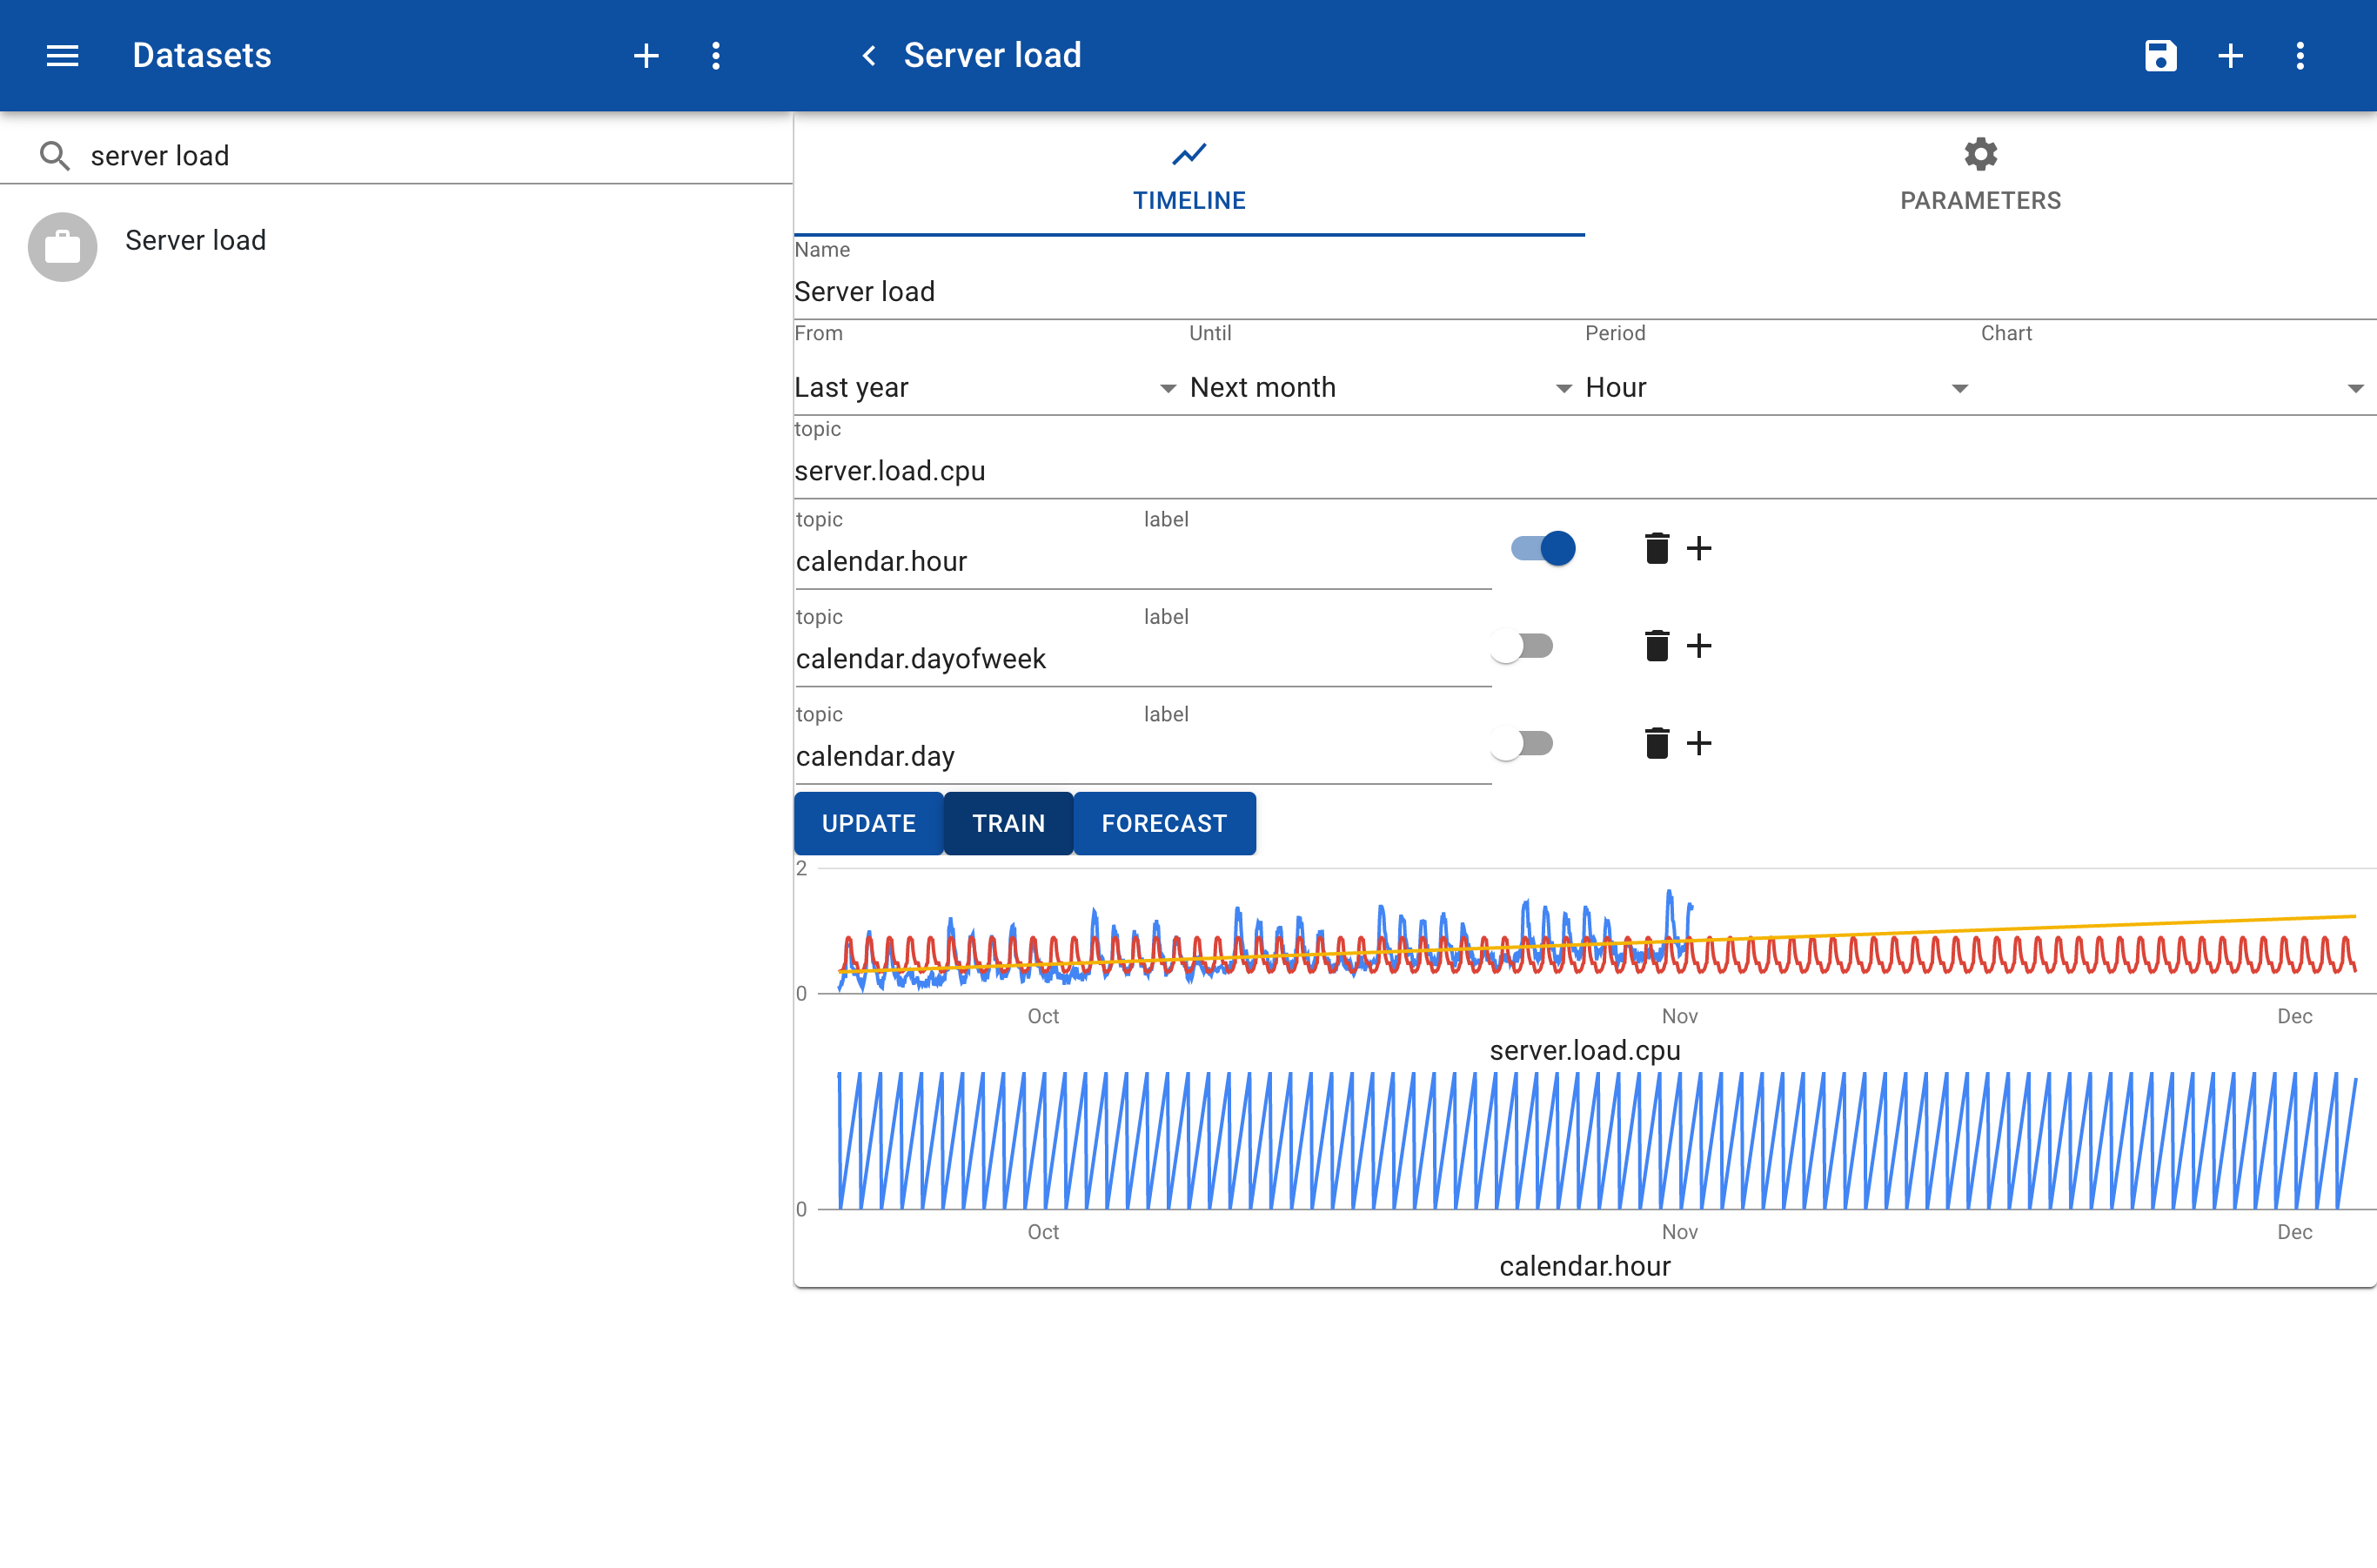
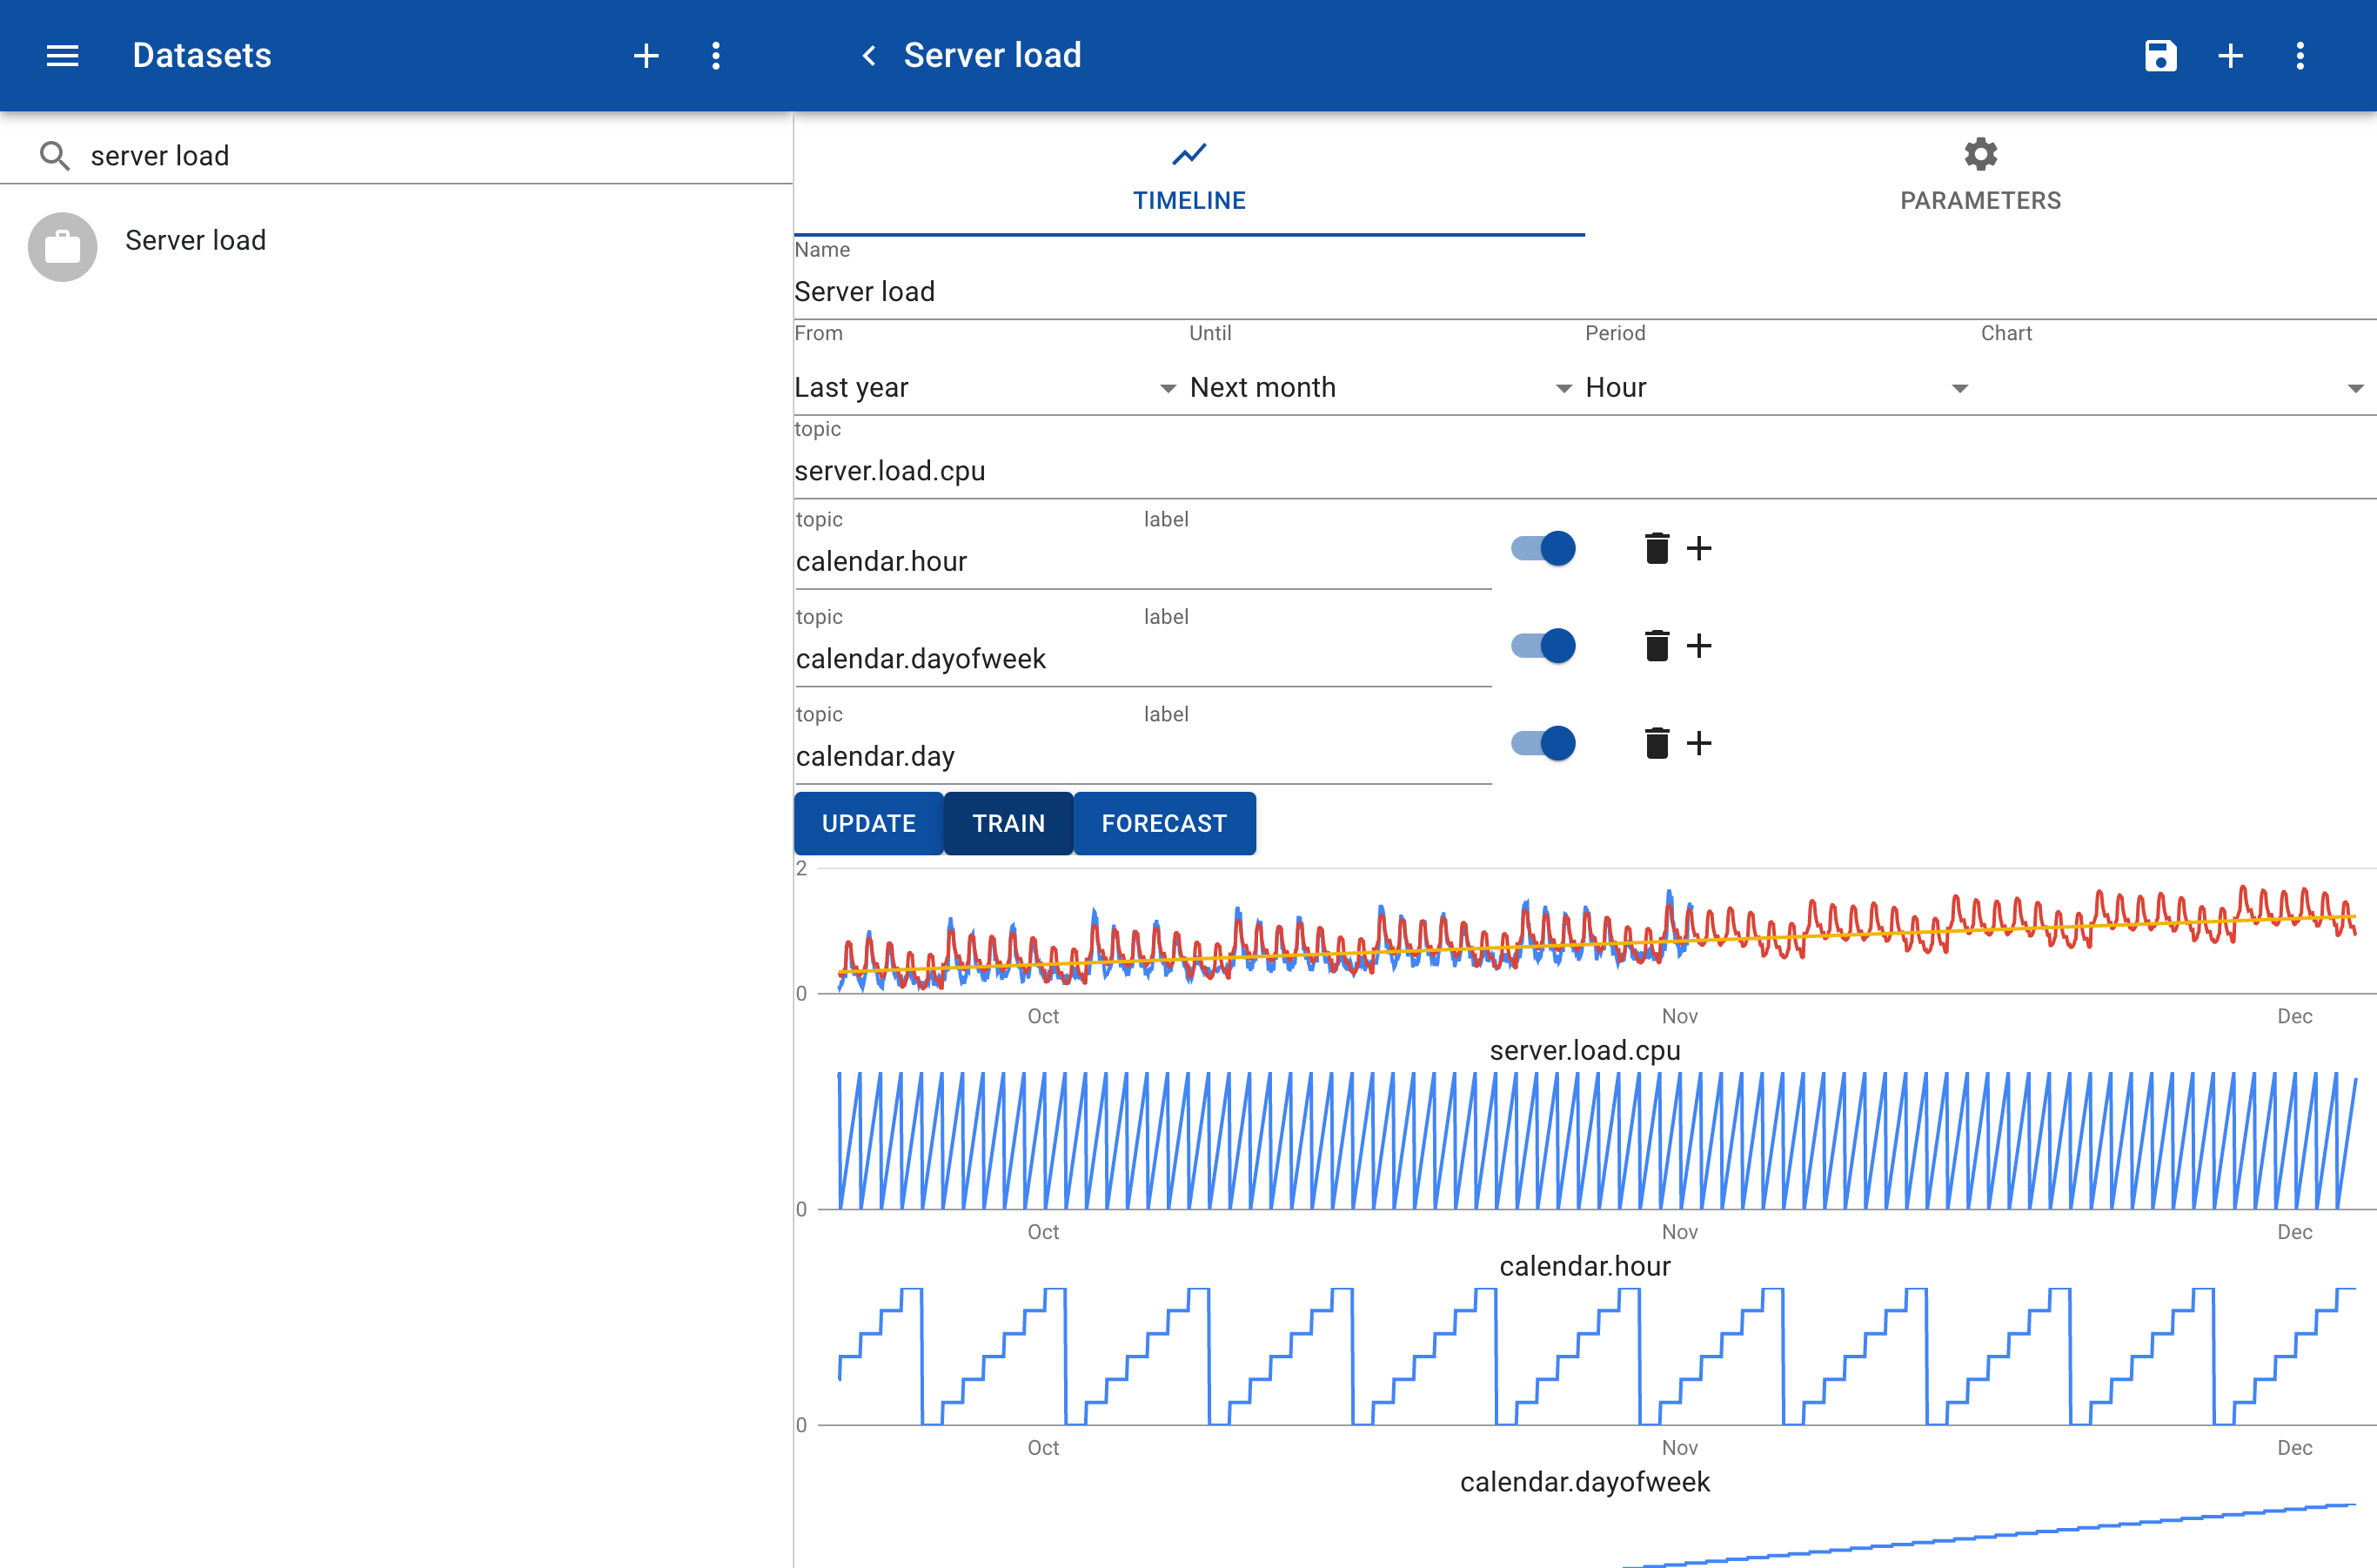
Note that this prediction does not take in to account the increased load during the course of the year and the week. When these features are added the prediction becomes more accurate.
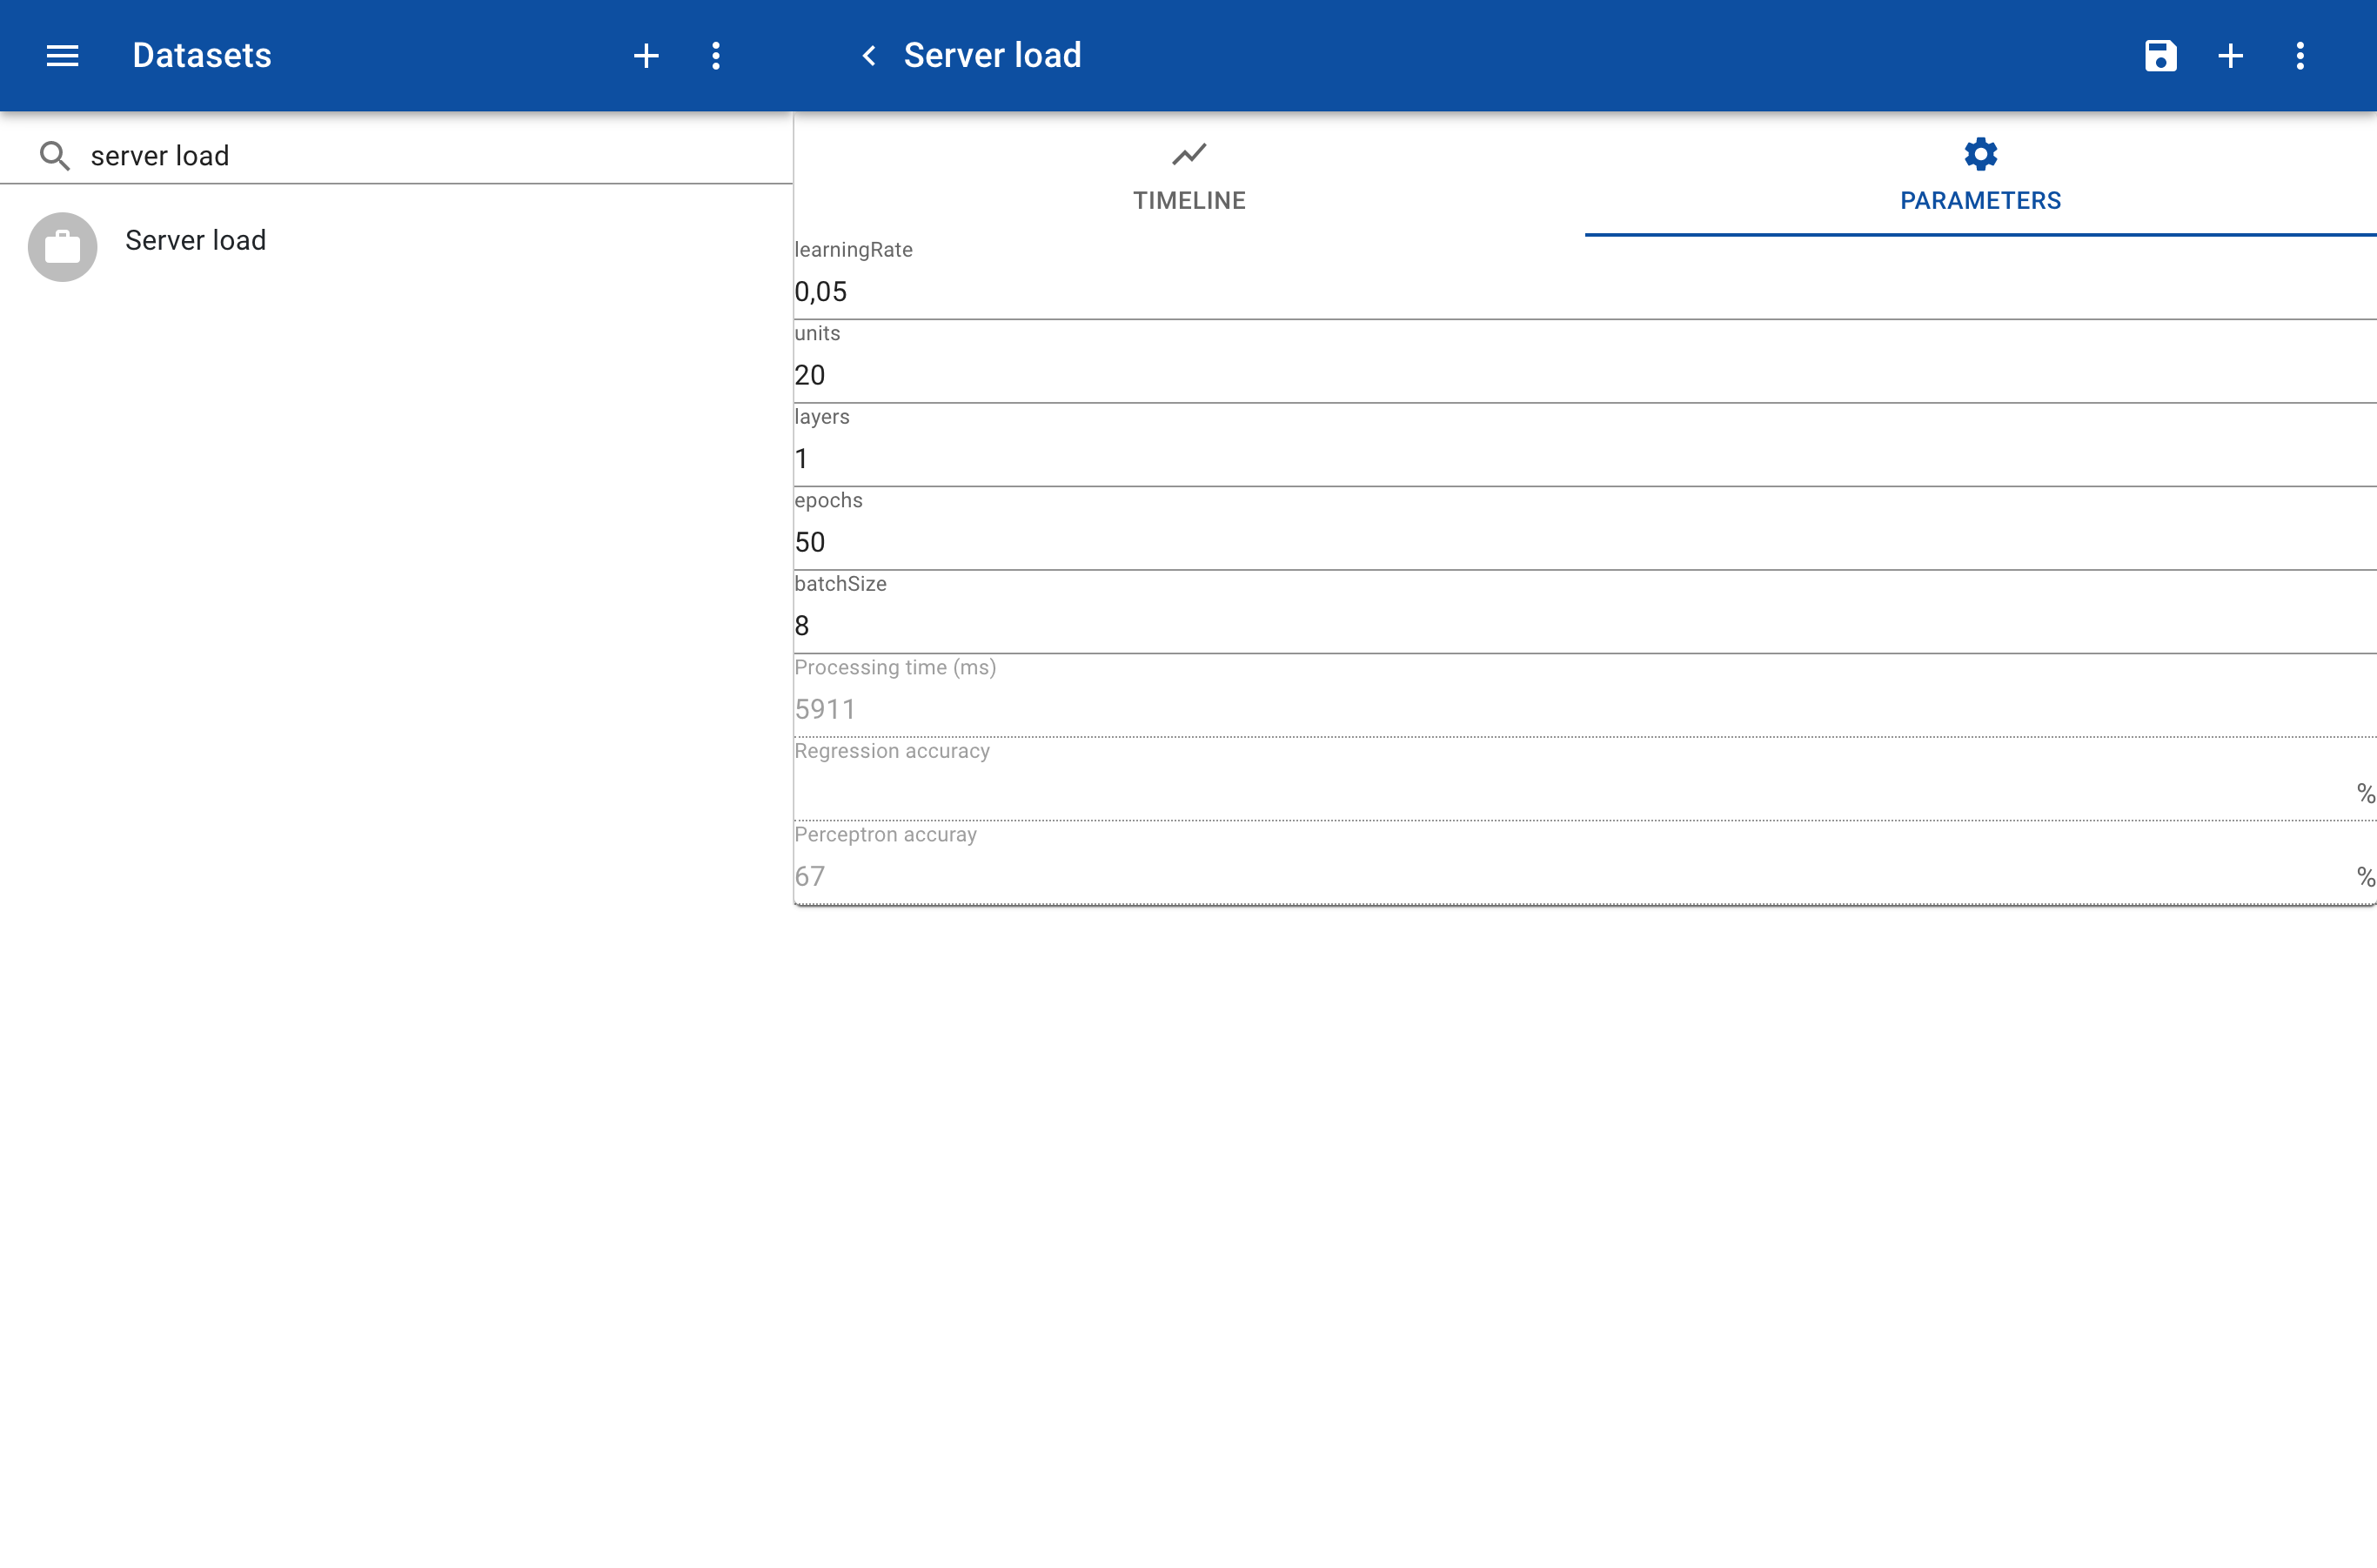
Forecasting is implemented with a TensorFlow multilayer perceptron neural network.
Users familiar with TensorFlow networks can finetune the machine learning parameters by clicking on the Parameters tab and then click Train.