Relationships
A key element in understanding the patterns in data is comparing values from different topics. For example, when predicting the required power for heating or cooling a building you may want to observe the outside temperature and wind conditions. When predicting the number of visitors to a theme park you may want to take into account the weather forecast and vacation calendar.
Merging multiple topics
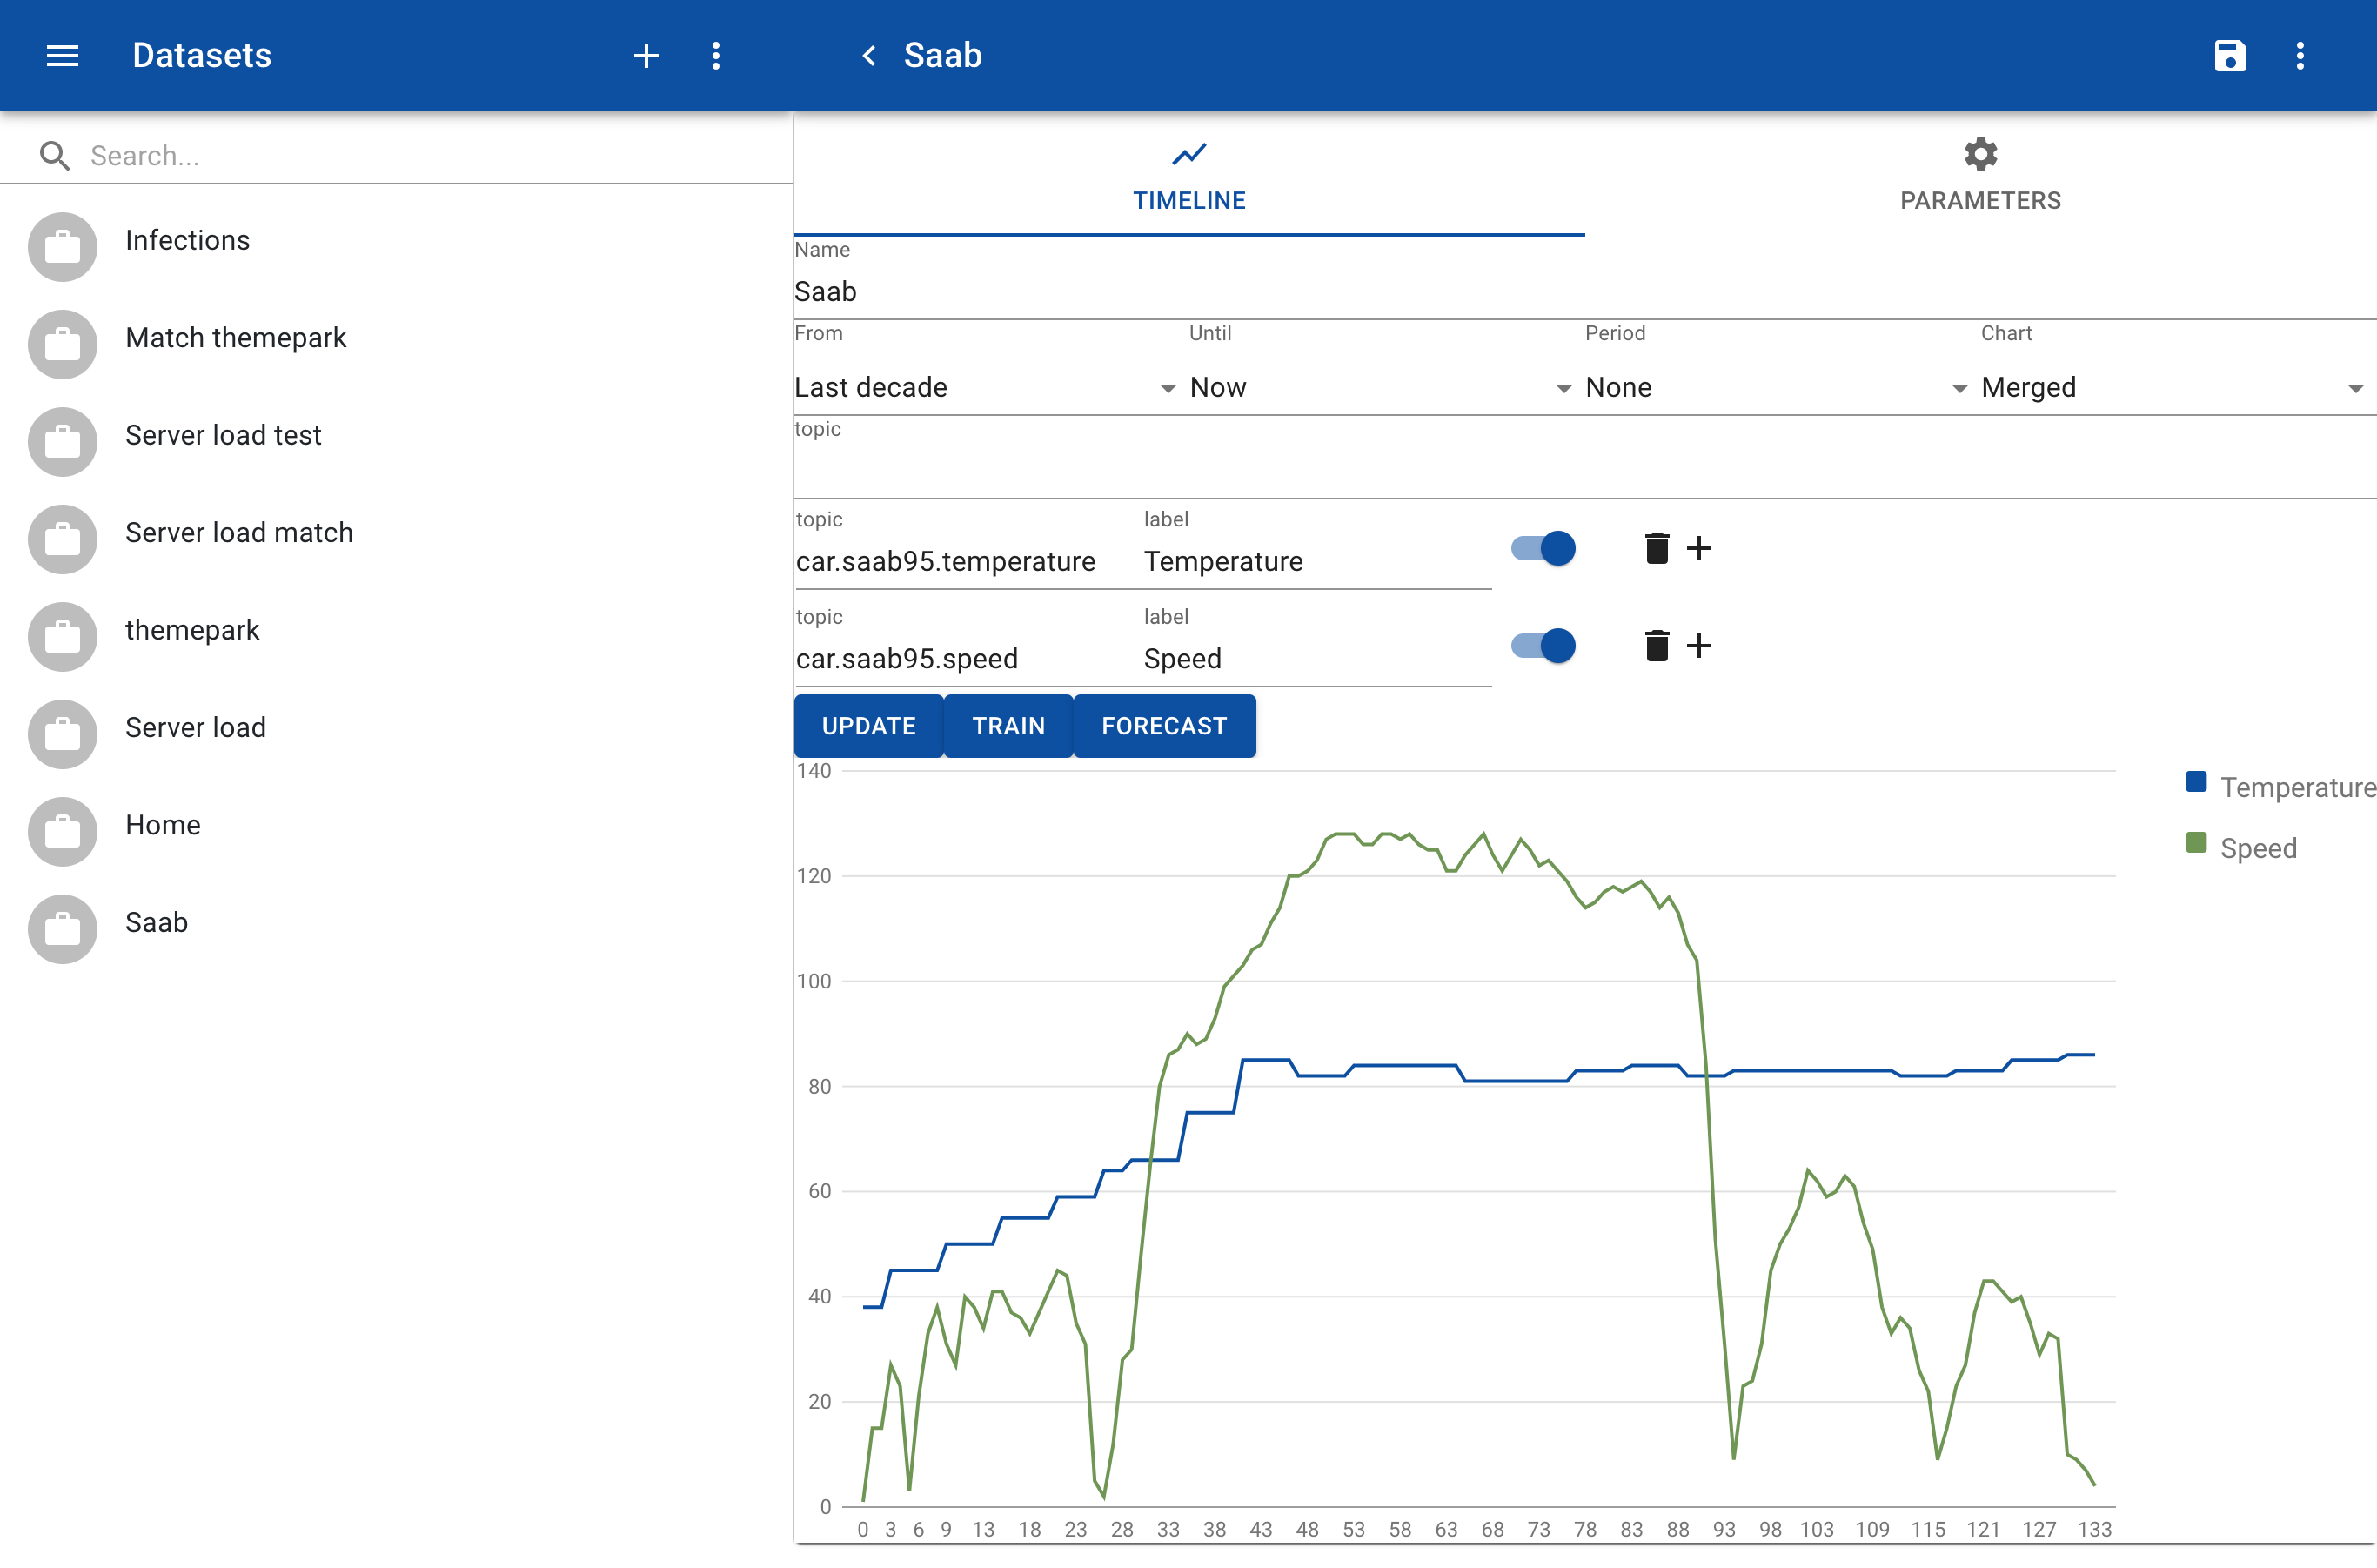
A first approach to find relationships is to show multiple values in a singe map. To show the timeline of multiple topics in a single chart go to Forecast and create a new dataset. Click on Add to add one or more topics and specify the time interval. If the dataset is large or if the topics are sampled at different intervals you need to specify a period. This ensures that the time ranges of the different topic values are synchronized. For example, if one value is sampled every 5 minutes and another value every hour you specify the period as Hour.
Predicting values
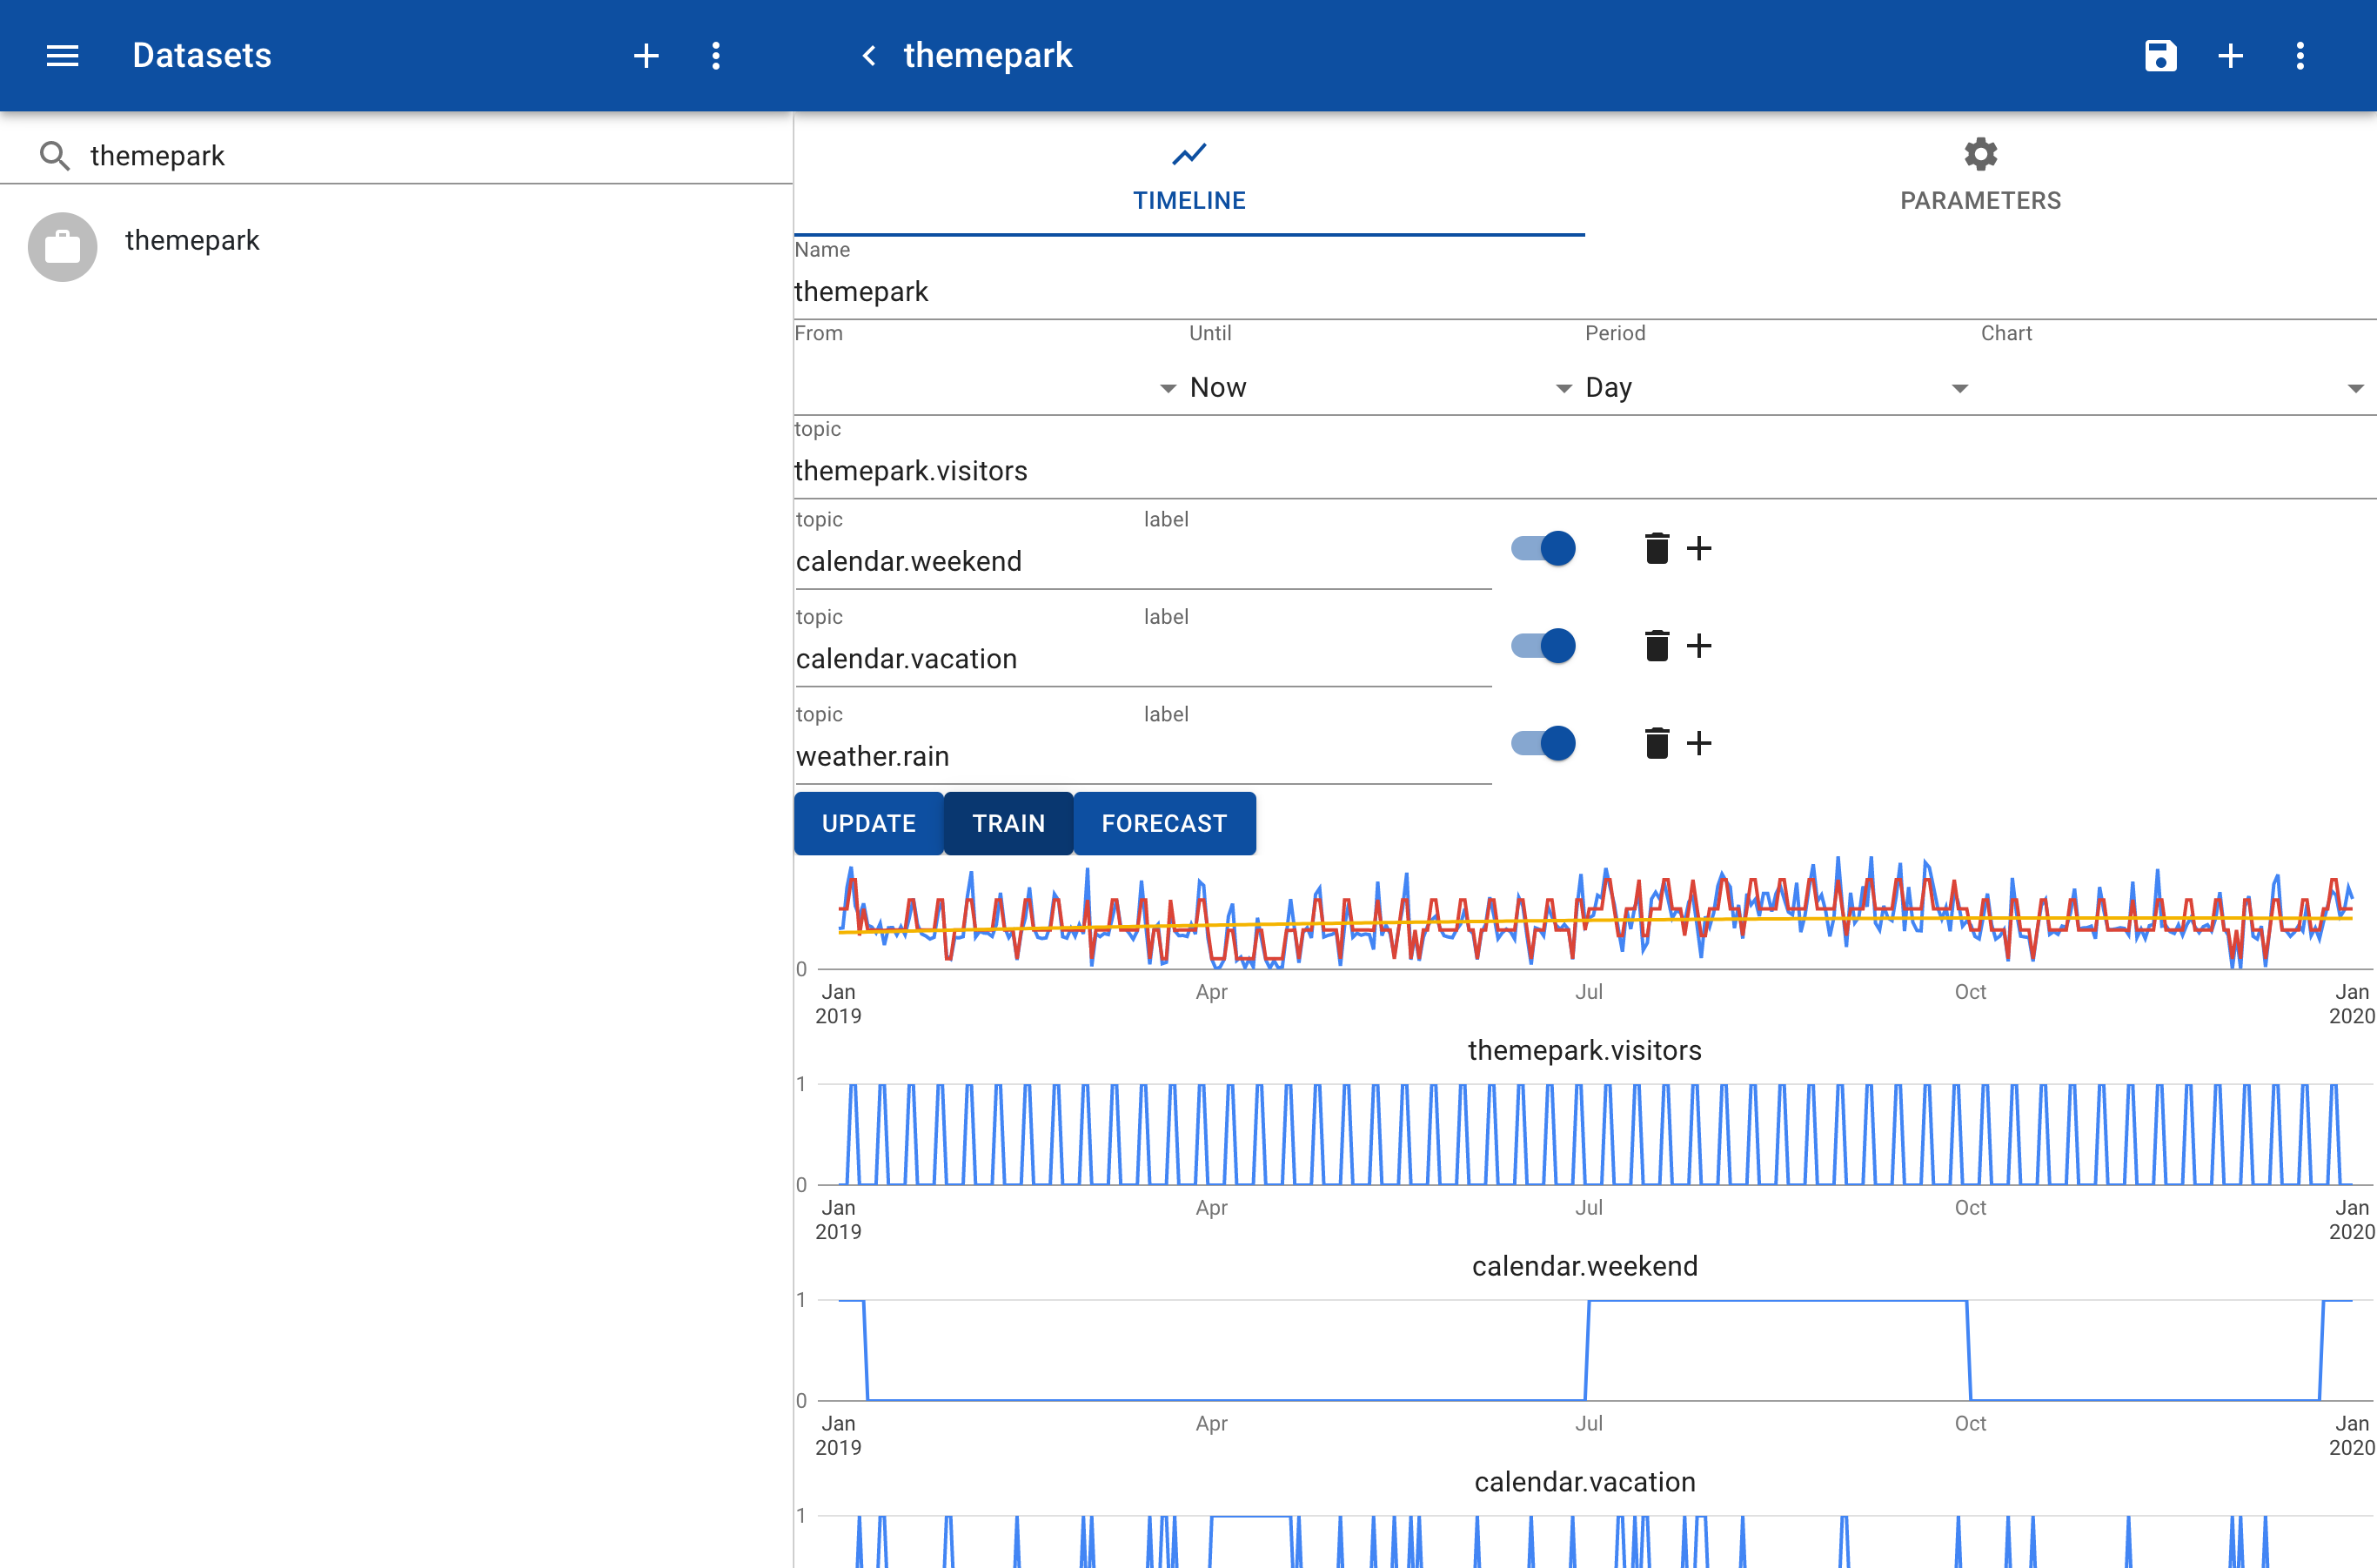
To predict the value of one topic based on several other topics create a dataset and enter the name of the topic you want to predict. Add one or more other topics that may have a relationship. In this case the topic to predict is themepark.visitors and we add an other topic calendar.weekend. Click on Train to train the network. The predictions are shown by a red line.
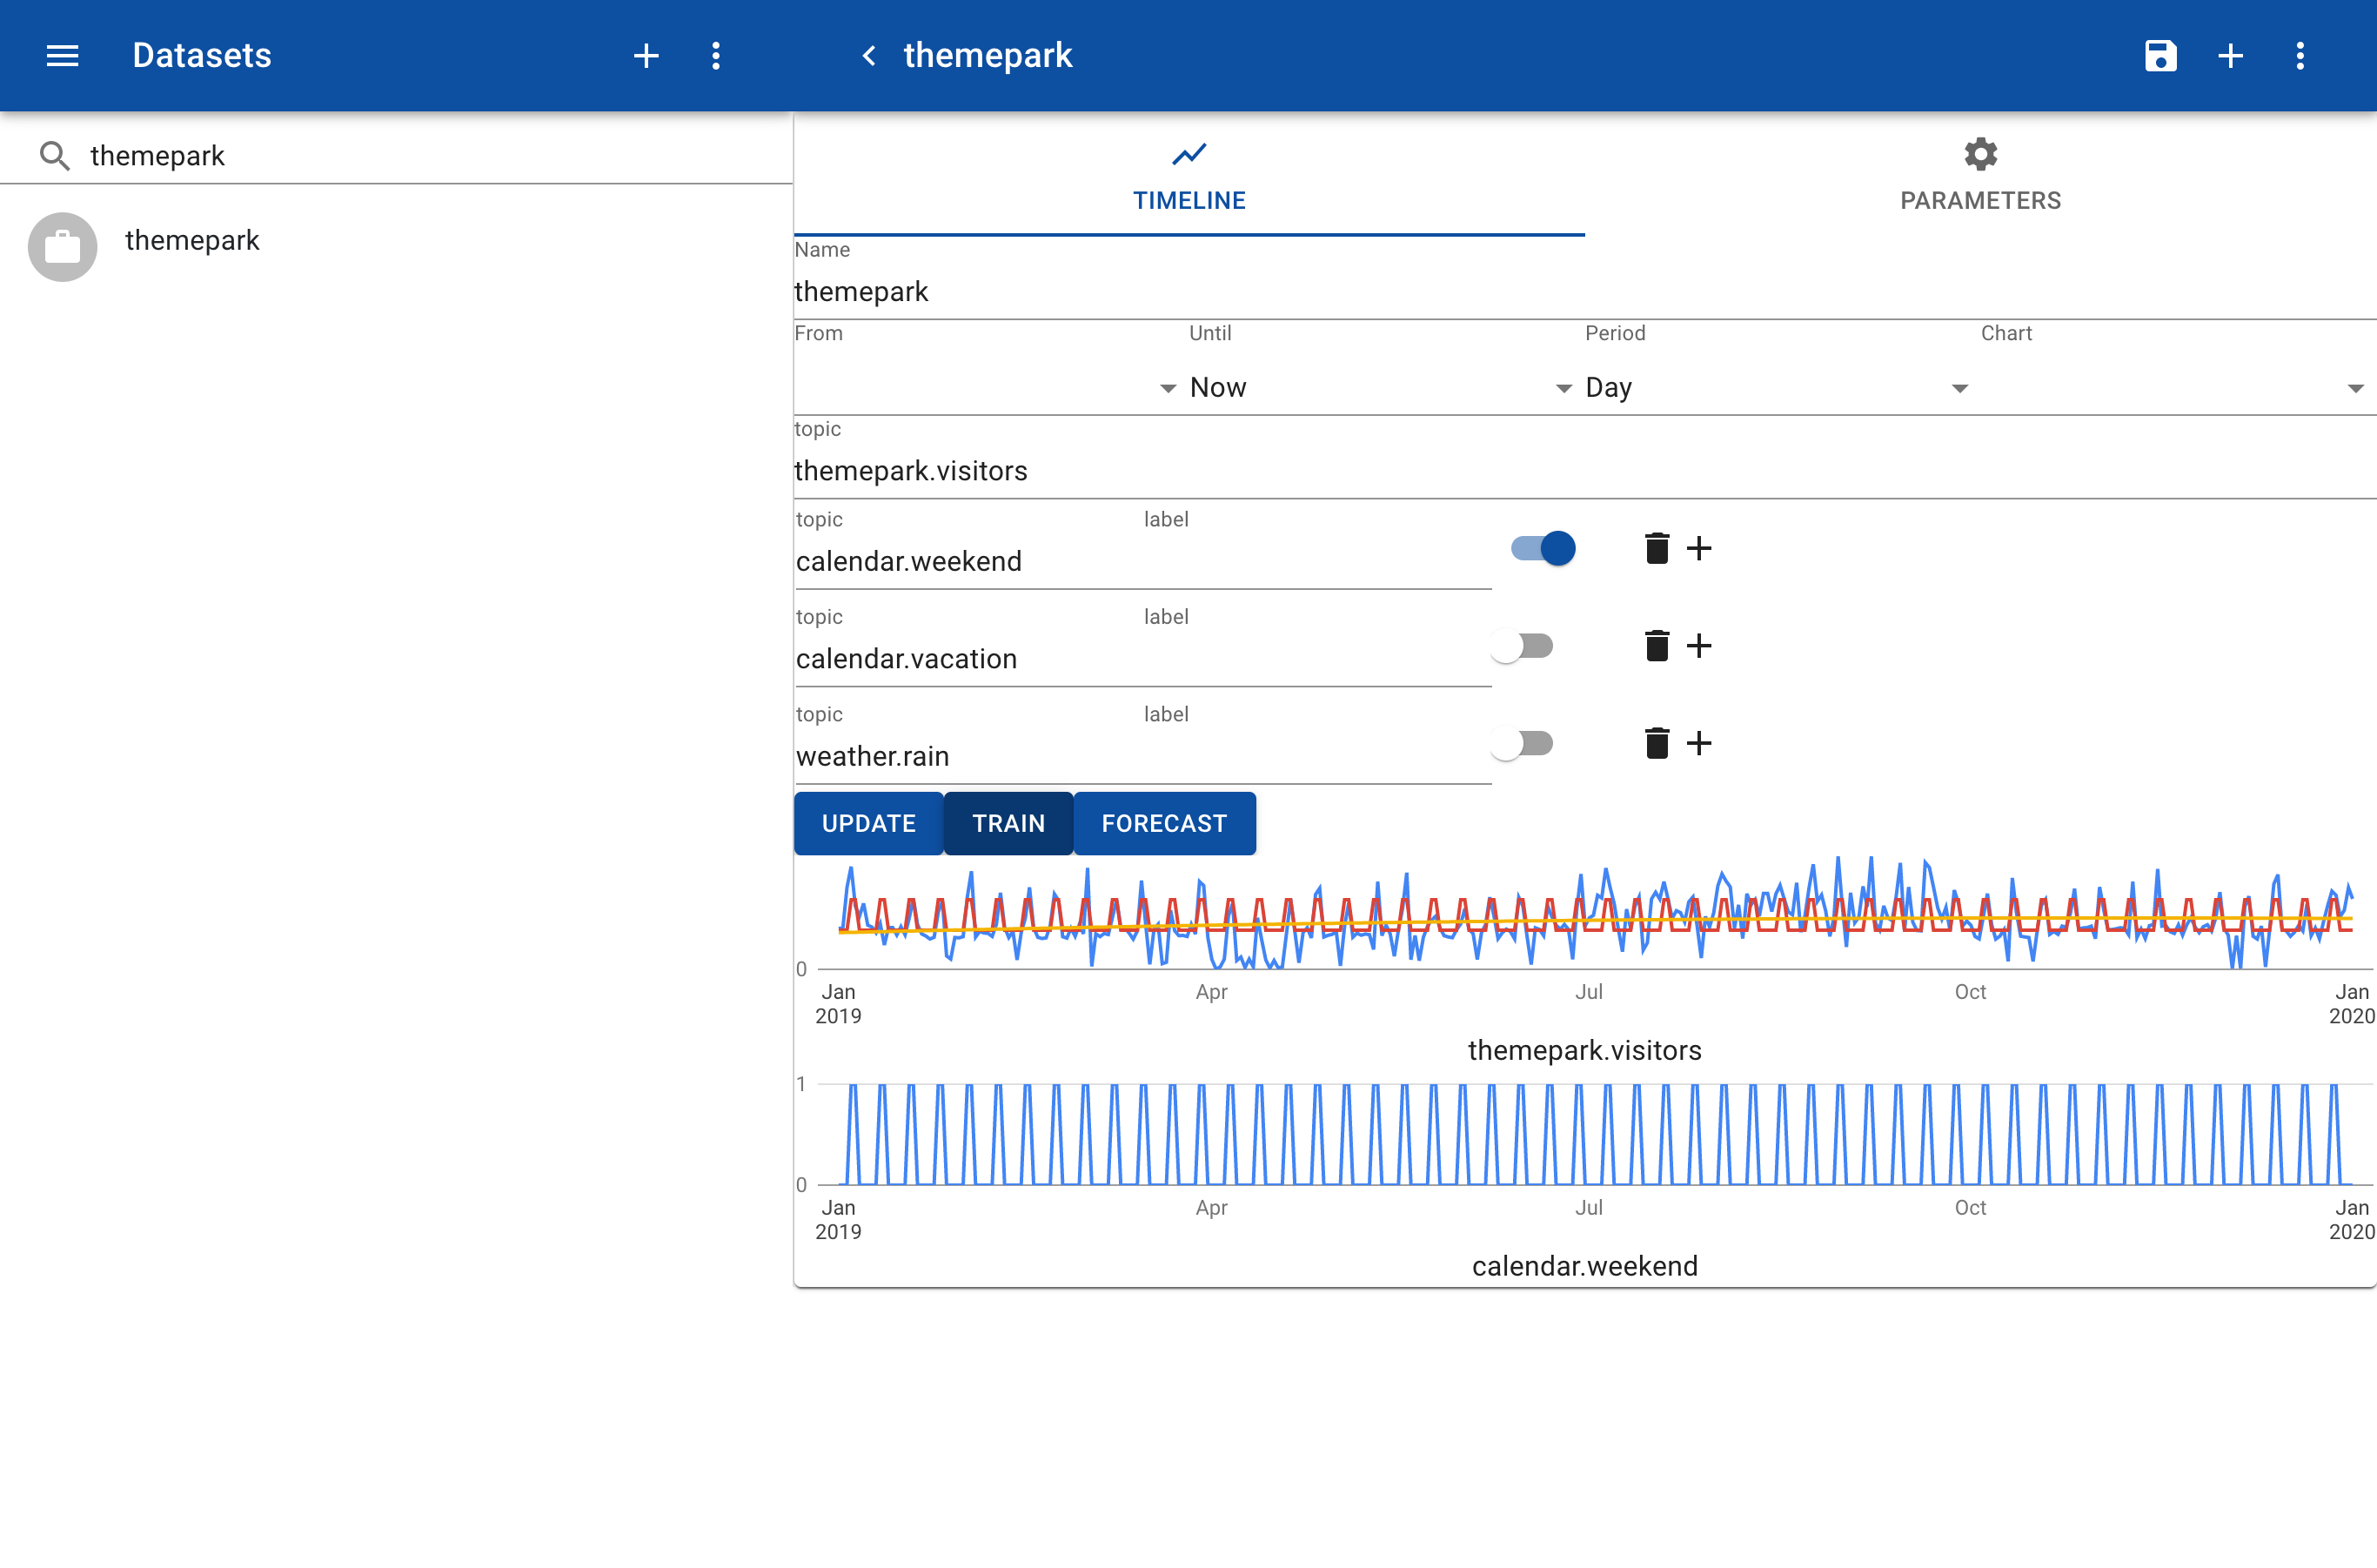
By adding more features such as weekend or vacation the prediction may become more accurate. Once the prediction is good enough this can be used to forecast. For example, if want to predict the number of visitors next saturday it is already known that this is a weekend and whether or not the date falls in a vacation period. If you add the weather forecast the prediction may be quite accurate.