Aggregation
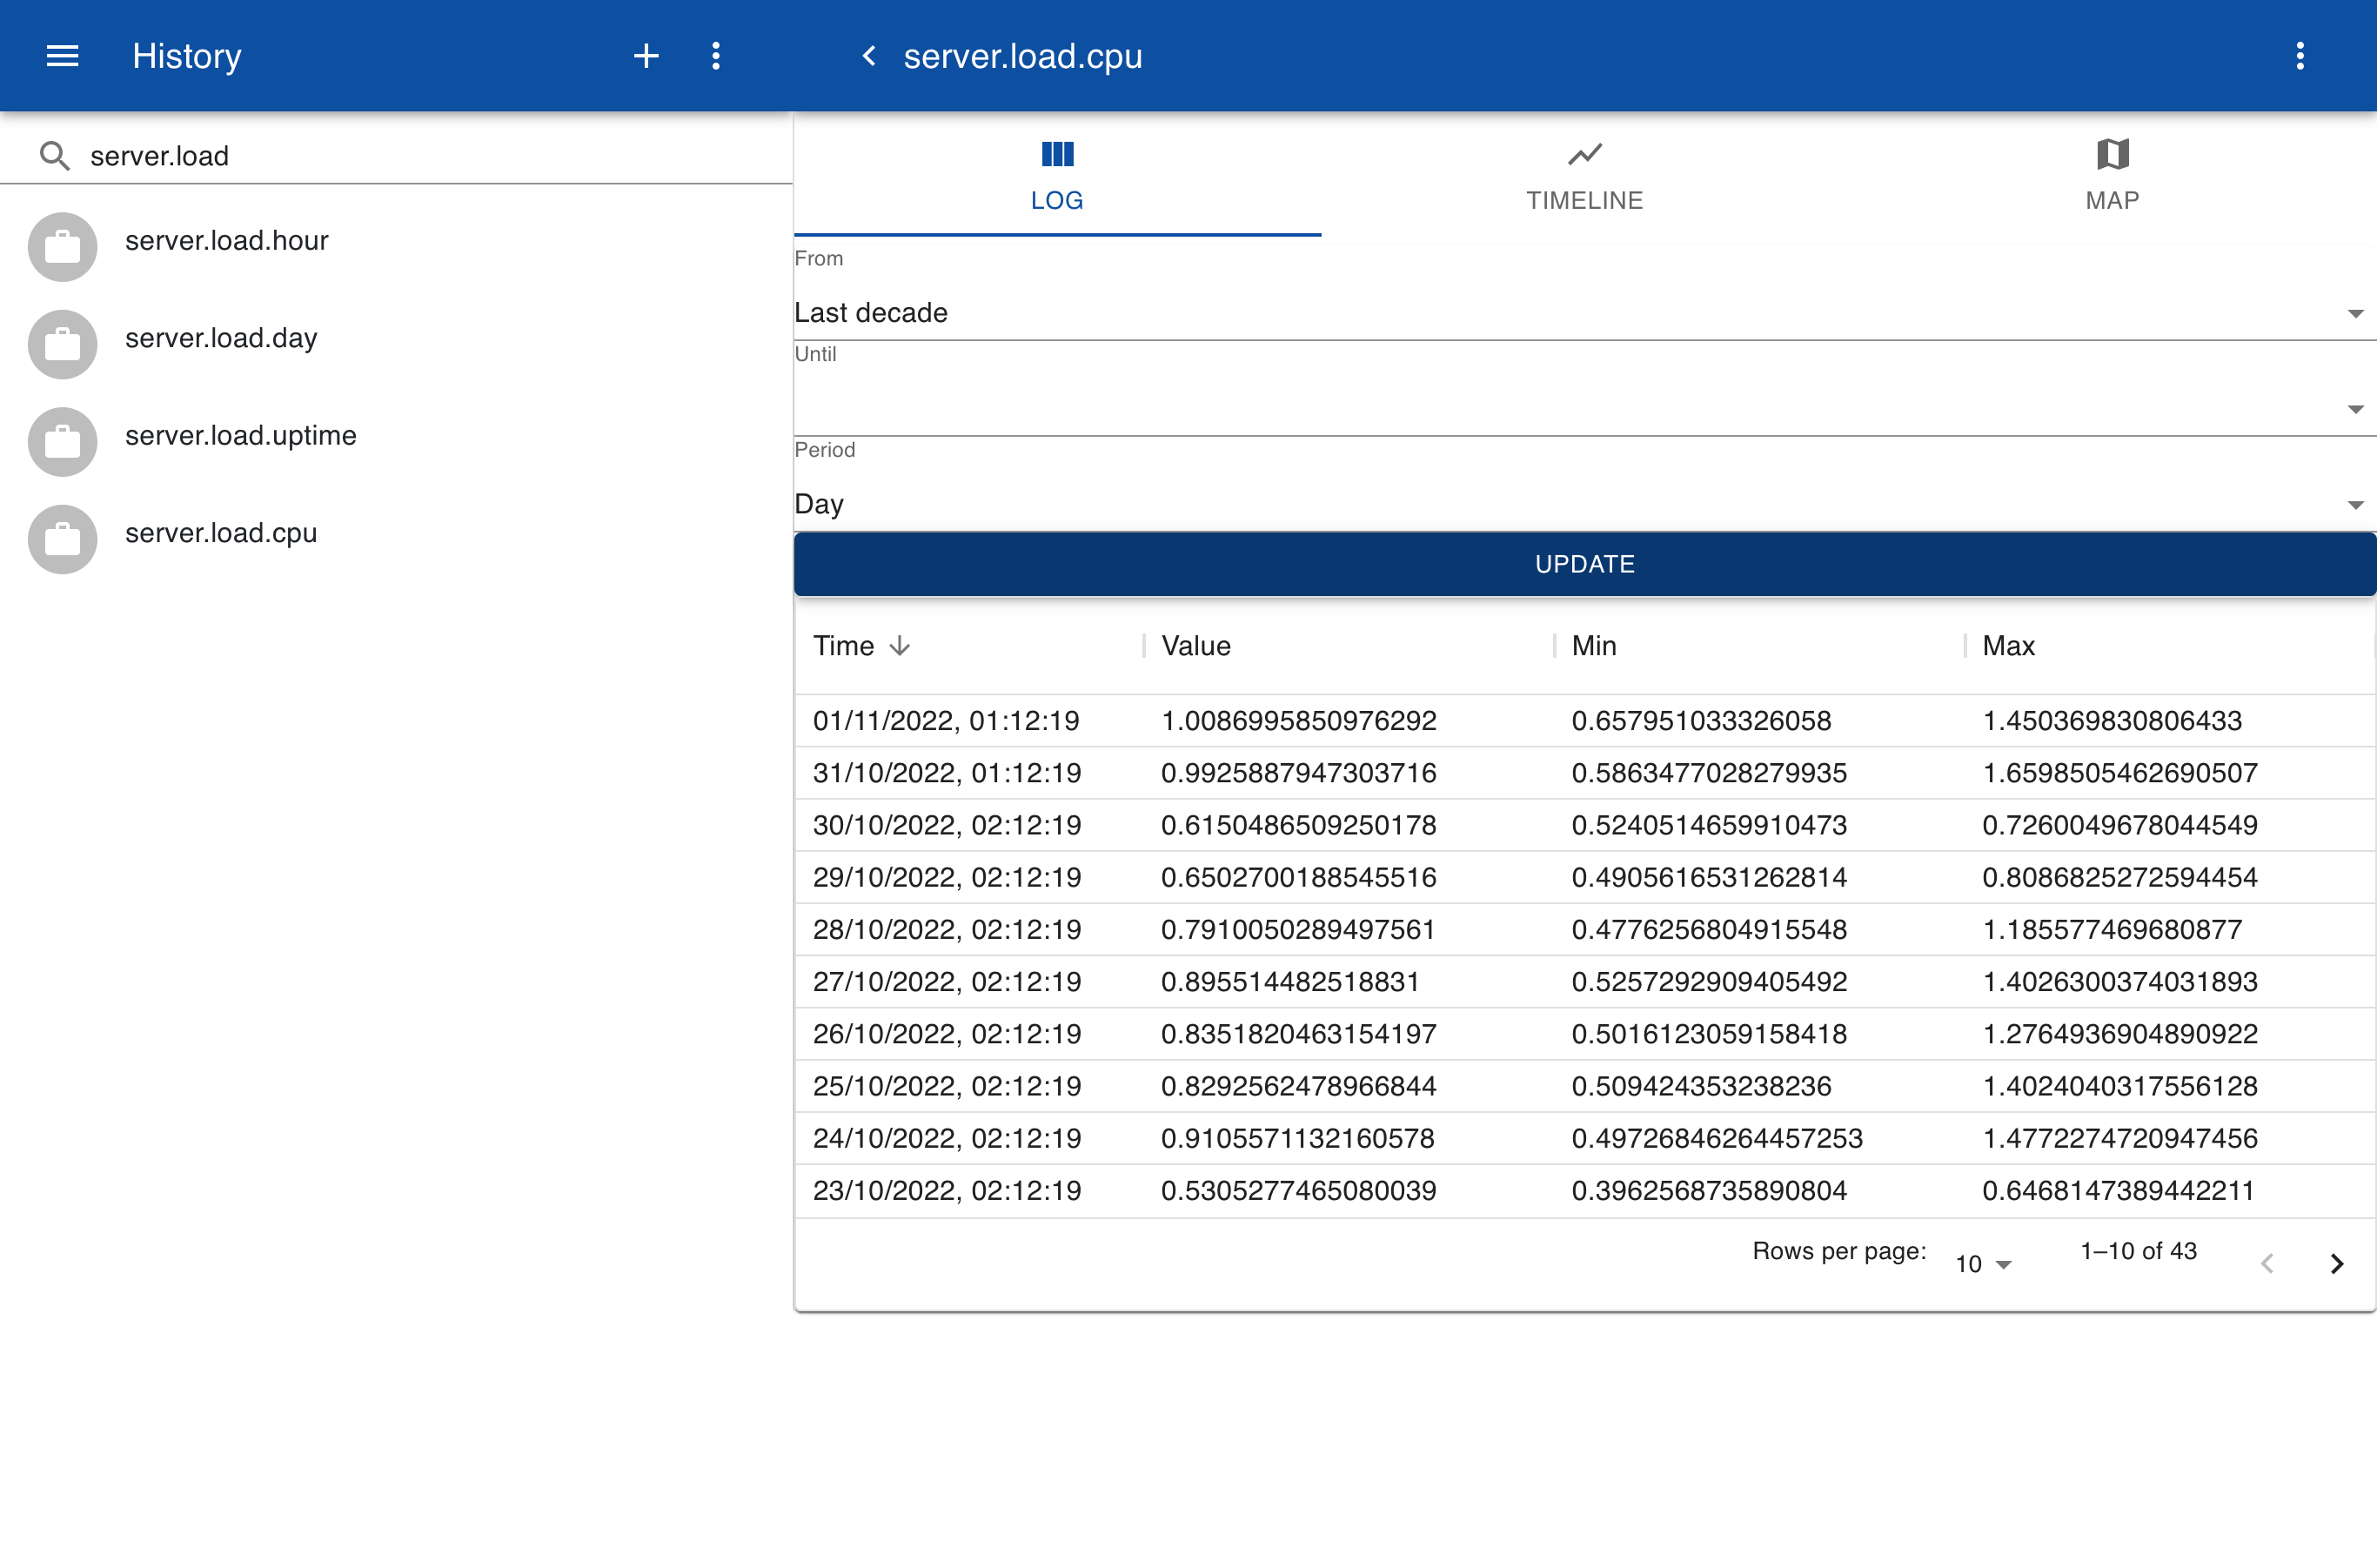
When data is collected every 5 minutes and you want to analyze a long period the size of the dataset becomes too large for interactive viewing in a time chart or on a map. Data can be compressed by aggregation over a period. This means that for that period an average value, a minimum value and a maximum value is calculated. After selecting the period click on Update to get the aggregated data.
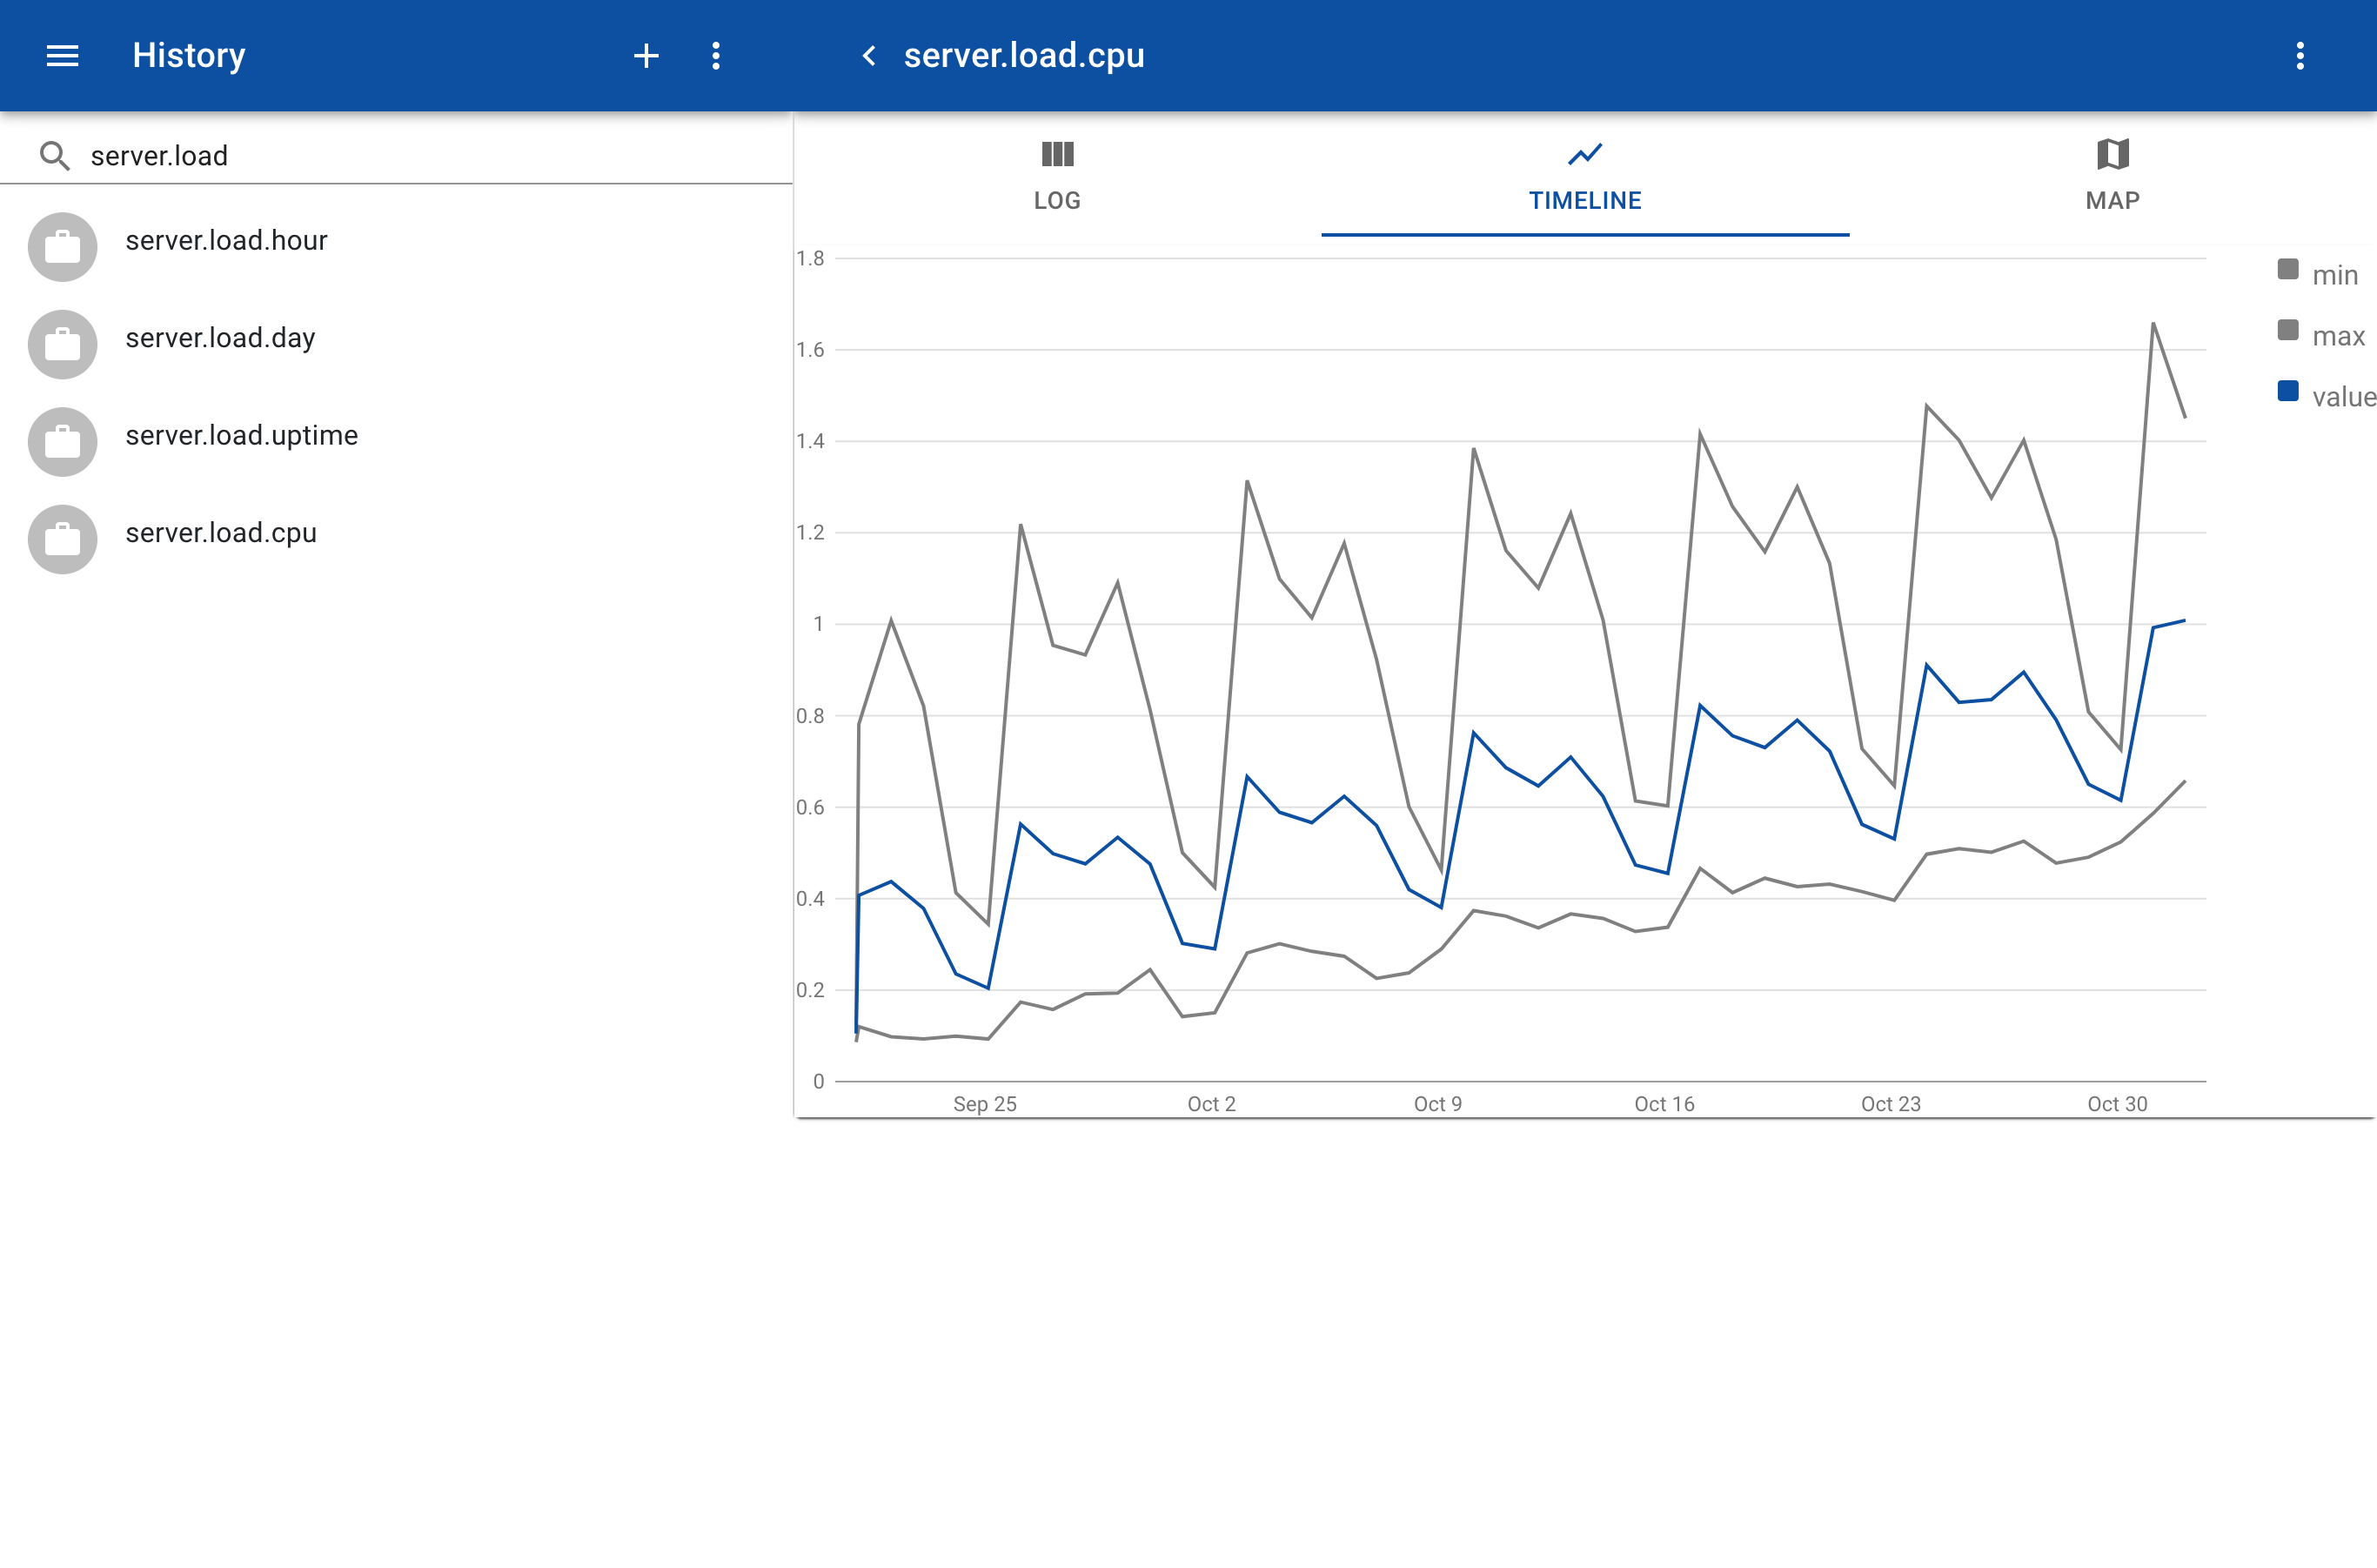
When aggregated data is displayed in a timeline the minimum and maximum values are displayed as well.