Monitoring
SVG diagrams can be used for real time monitoring and data visualization. In this example we show how to simulate aircraft monitoring by subscribing to messages from an MQTT server that represent the current state of two aircraft with the id pdzld and phylw. The current state is provided as a comma separated list of six numbers that describe the speed, heading, altitude, selected altitude, pitch and bank angle.
MQTT
We use the free and open source MQTT client 'mosquitto_pub' to send a message with the state information. The host is the free MQTT host broker.hivemq.com and the topic is spacetime/aircraft followed by the ID of the aircraft.
mosquitto_pub -h broker.hivemq.com -t spacetime/aircraft/phzld -m "70,30, 1000,1300,10,0"
mosquitto_pub -h broker.hivemq.com -t spacetime/airplane/phylw -m "140,210, 2000,4000,0,10"
Connector
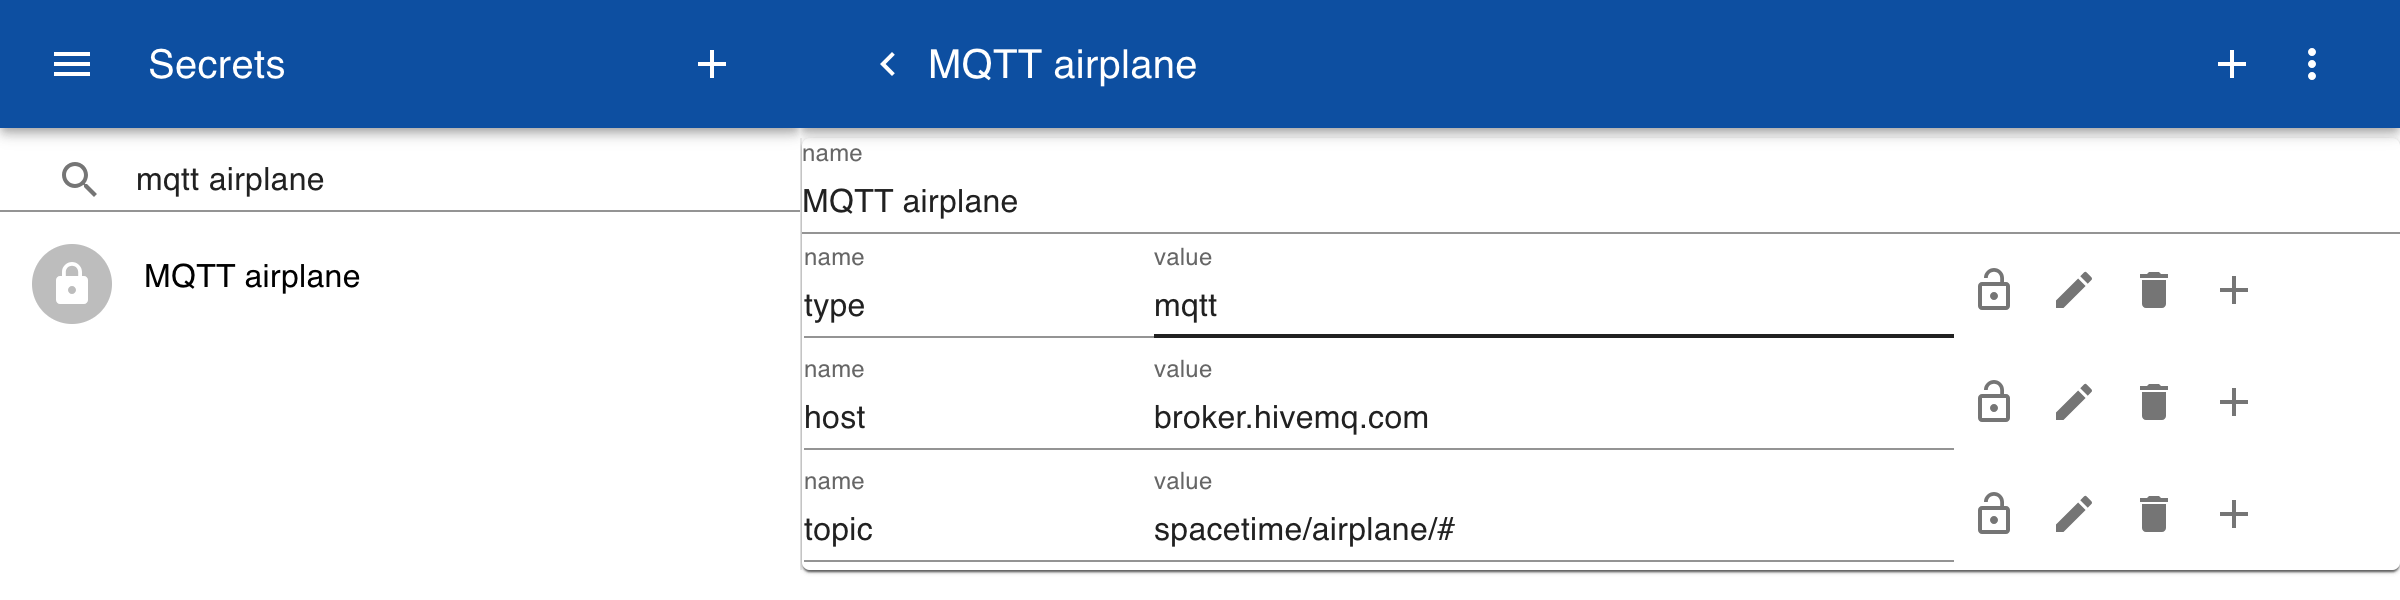
To receive the messages we first define a secret to store the information for the MQTT host. The type is set to MQTT and a free public domain host broker.hivemq.com is entered. This host does not need authentication. Then we specify the topic to which we want to subscribe. The # sign means that we want to subscribe to all subtopics.
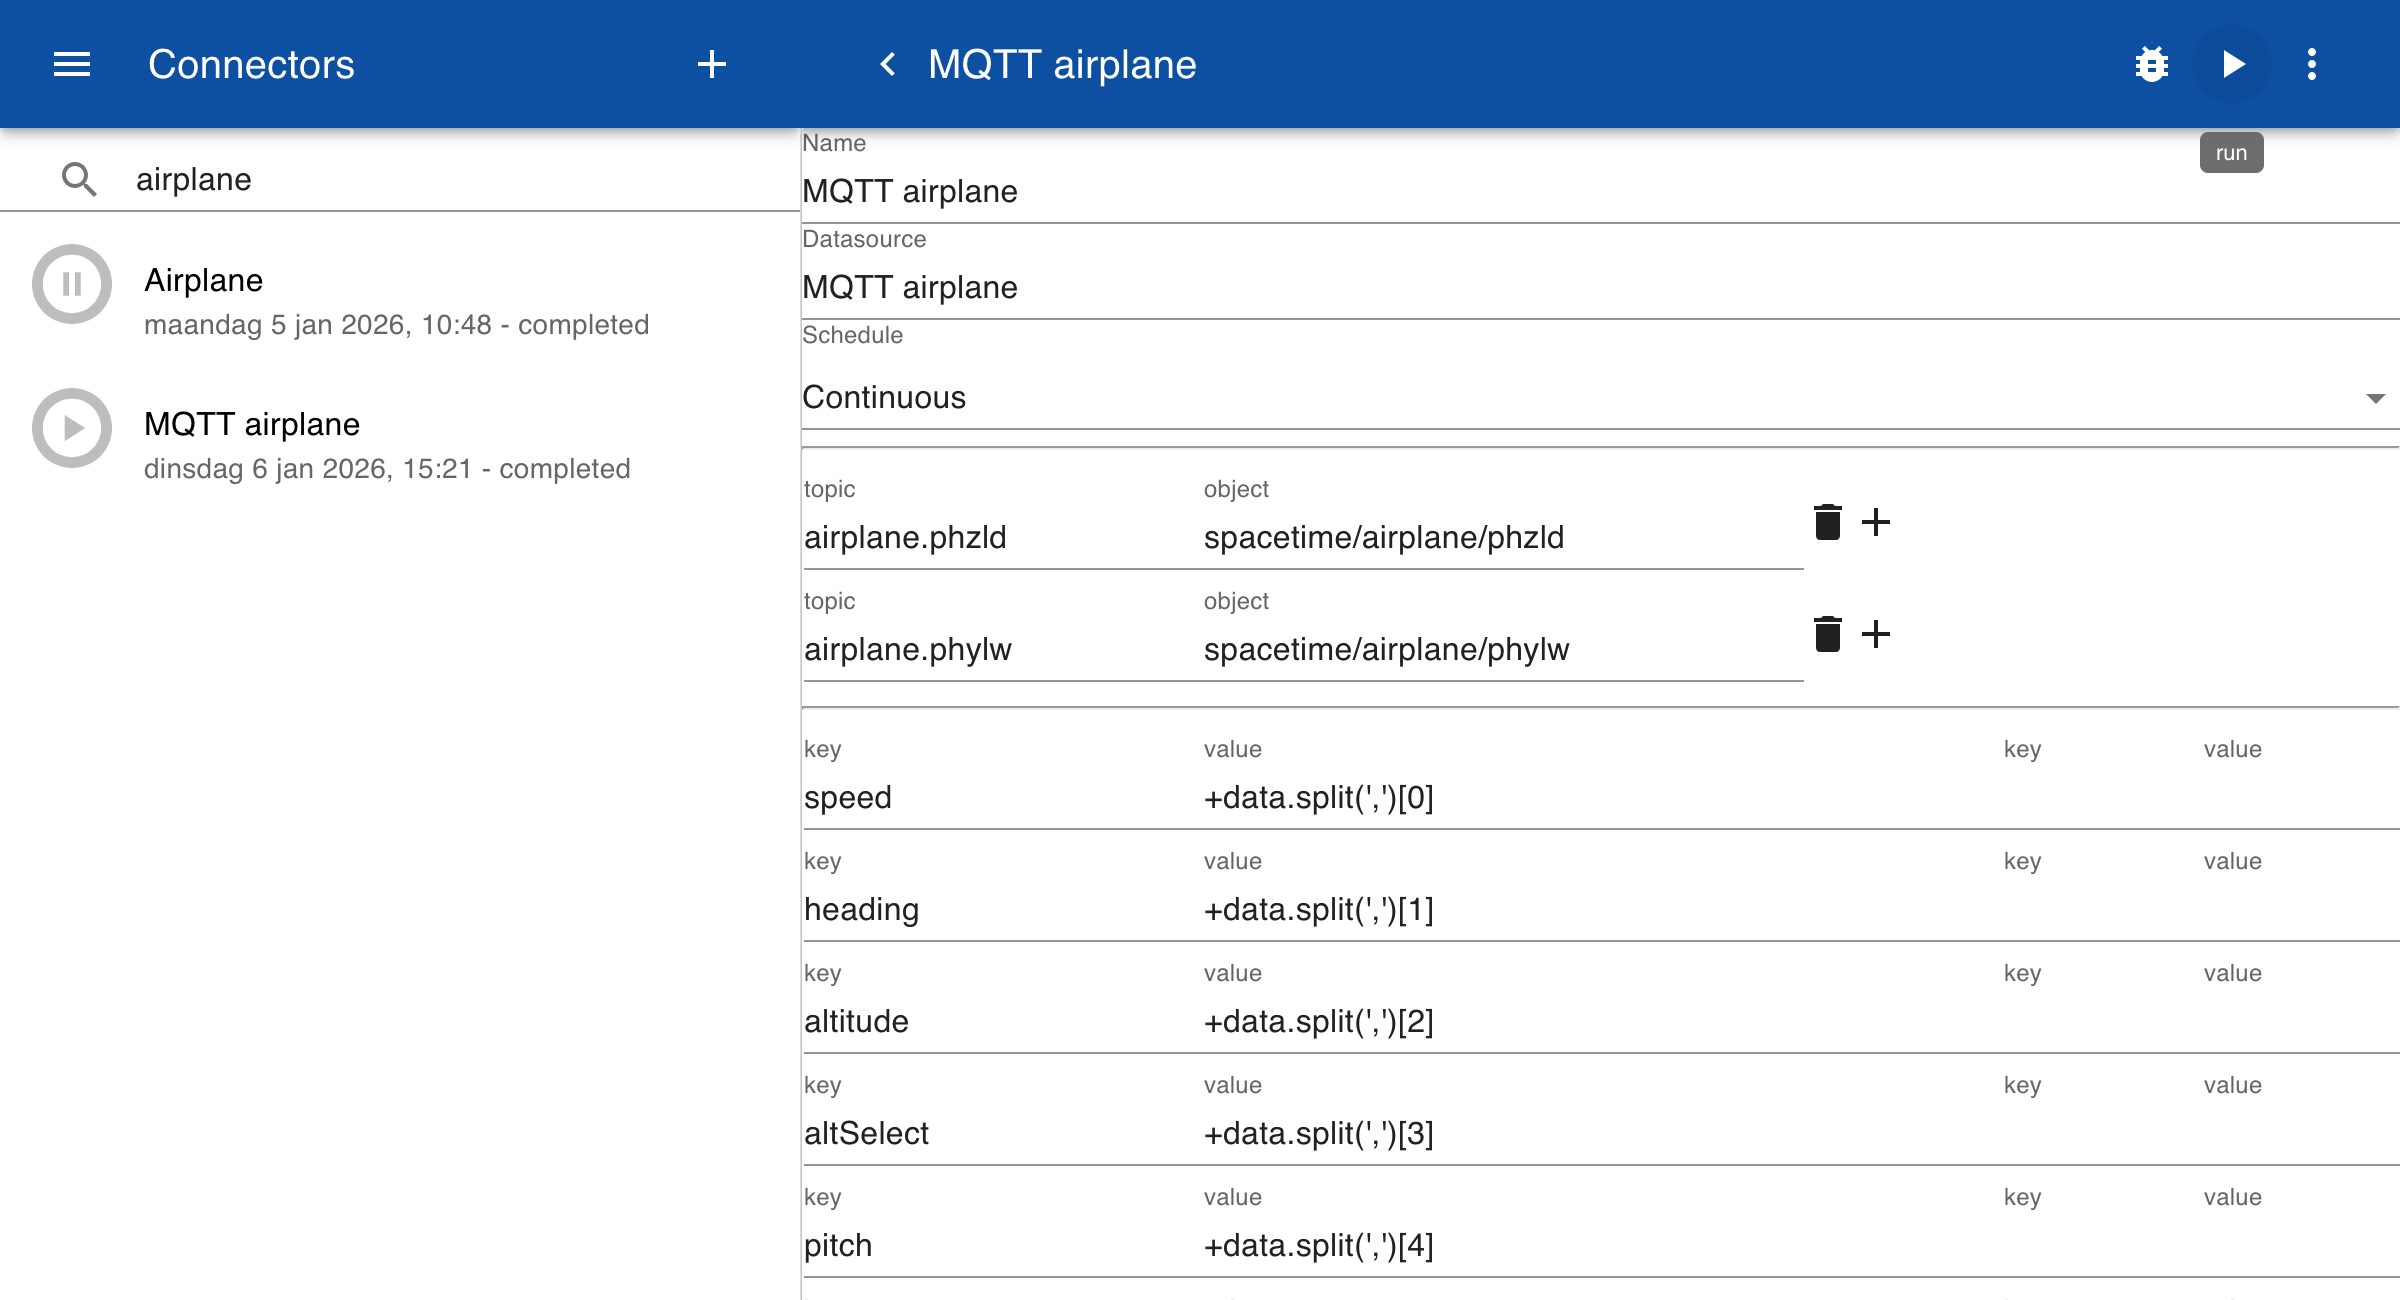
Create a new connector and add two object mappings. For each topic define the corresponding mapping to the MQTT topic and then click on test. In the data field you can see how the information from the MQTT host is mapped to a JSON object. The topic is stored in the object field and the message is stored in the data field.
[
  {
    "object": "spacetime/airplane/phzld",
    "data": "70,30,1000,1200,10,0",
    "time": "2026-01-03T12:52:26.358Z"
  },
  {
    "object": "spacetime/airplane/phylw",
    "data": "140,210, 2000,4000,0,10",
    "time": "2026-01-05T14:03:11.676Z"
  }
]
You can map the values in the comma separated list to keys, or sub topics, using the JavaScript split function. This converts the string into an array and each value can be retreived via an index in the array. The + sign converts the text to a number. After testing the connector set the schedule to Continuous. This way the connector is run automatically when new data is received from the MQTT server.
Diagram
To connect drawings to topics you can use special subtopics:
| topic | Description |
|---|---|
| geometry | Name of SVG file or drawing with parameters. |
| translation | Comma separate list of x,y values for positioning the drawing. |
| rotation | Comma separate list of angle and x,y values for the rotation center point. |
| scale | Comma separated list of x,y values for scaling the drawing. |
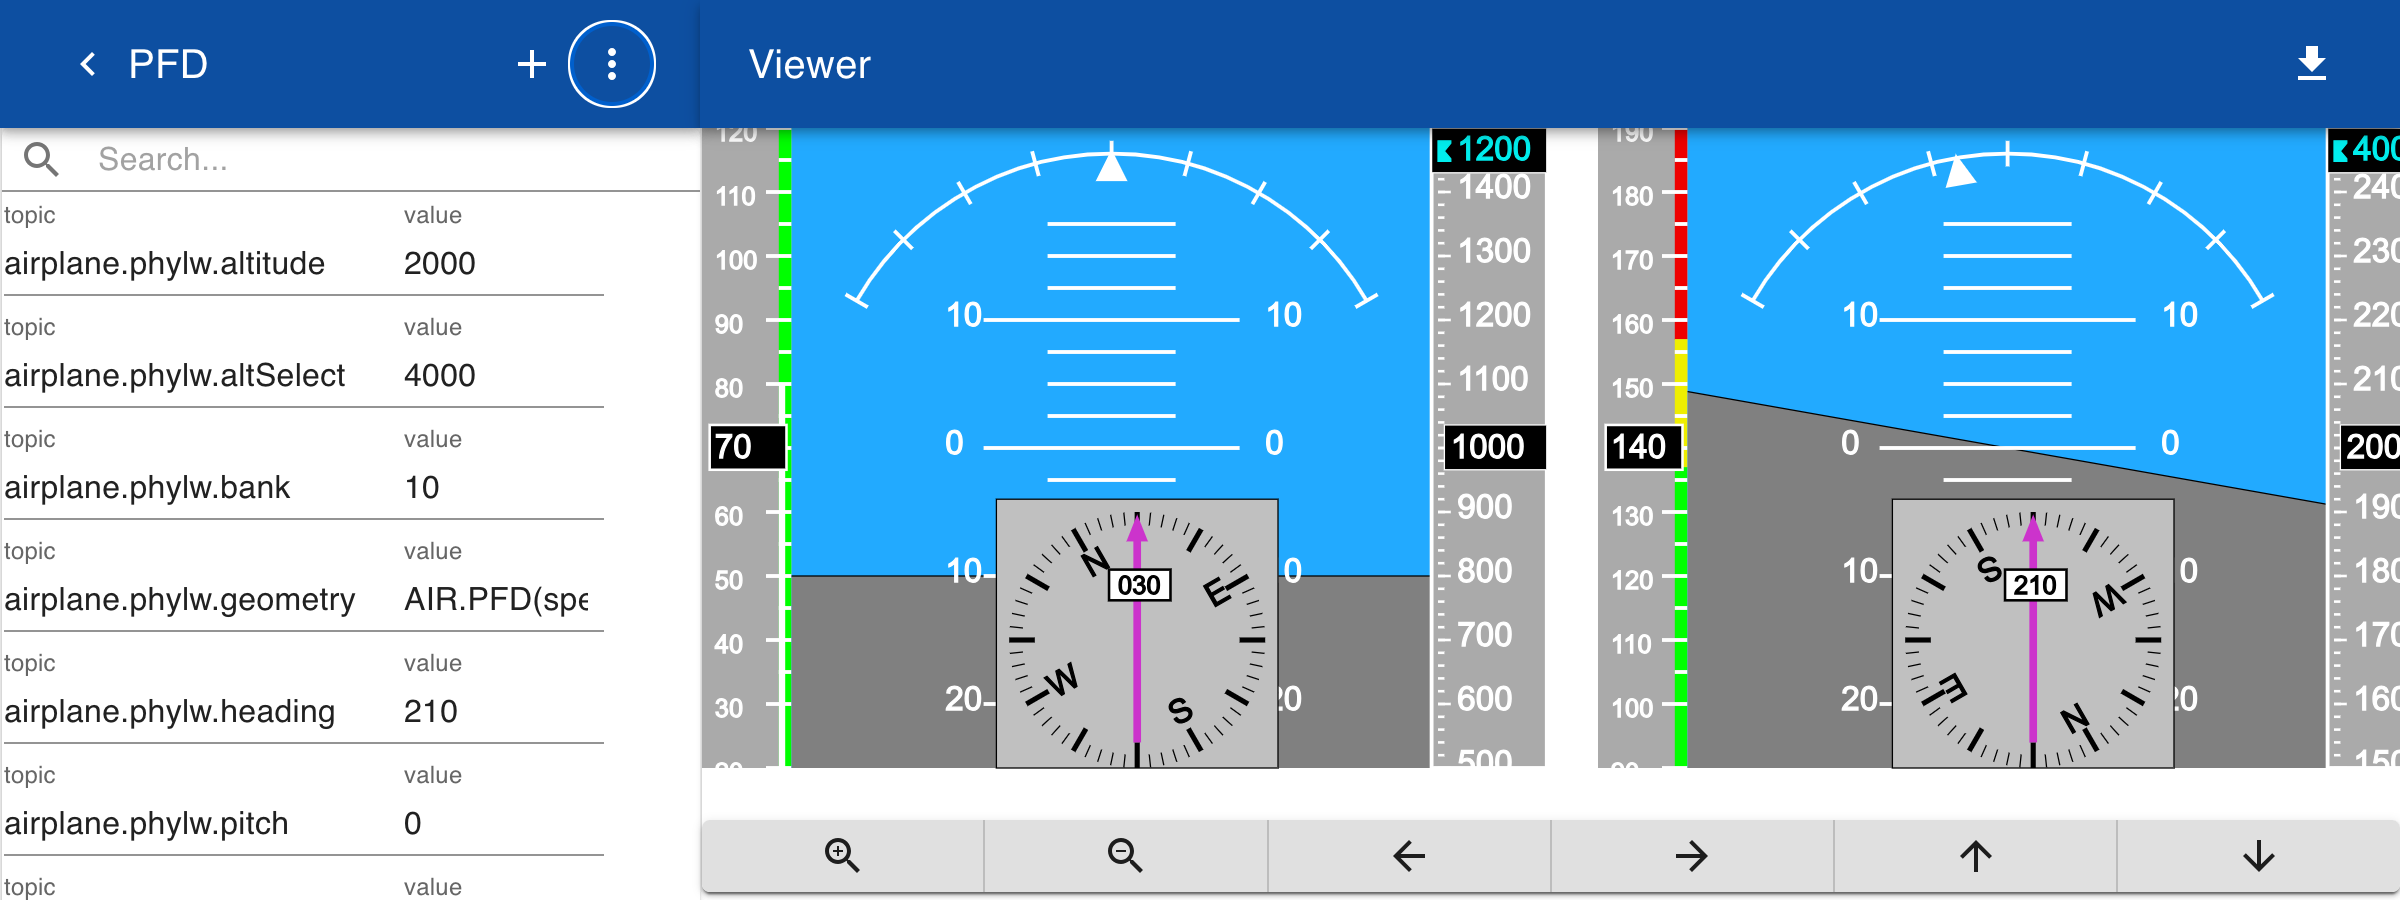
For each aircraft add a geometry subtopic with the name of the drawing and the parameters. A translation subtopic is added to move the origin of the second display next to the first display.
airplane.phzld.geometry = AIR.PFD(speed, heading, altitude, altSelect, pitch, bank)
airplane.phylw.geometry = AIR.PFD(speed, heading, altitude, altSelect, pitch, bank)
airplane.phylw.translation = 350,0
Create a new Diagram and add the topics airplane.phzld and airplain.phylw to load the topics from the database. In the menu select states to see the current values. You can now update the display by sending new MQTT messages or by changing the values in the web browser.