Light
In this example, we show how you can visualize IoT parameters by setting the intensity and color of lights. You can use this to visualize traffic signs in a smart city or show warning signs.
Solids
If you do not have a GLTF model of a railway sign you can create one with the built-in solid modeler. First, create the lamp from two flat cylinders and a flat block. The slanted cylinders are created by subtracting a cylinder from a slightly larger cylinder. The result, a hollow cylinder, is combined with a Wegde using the Intersect operation.
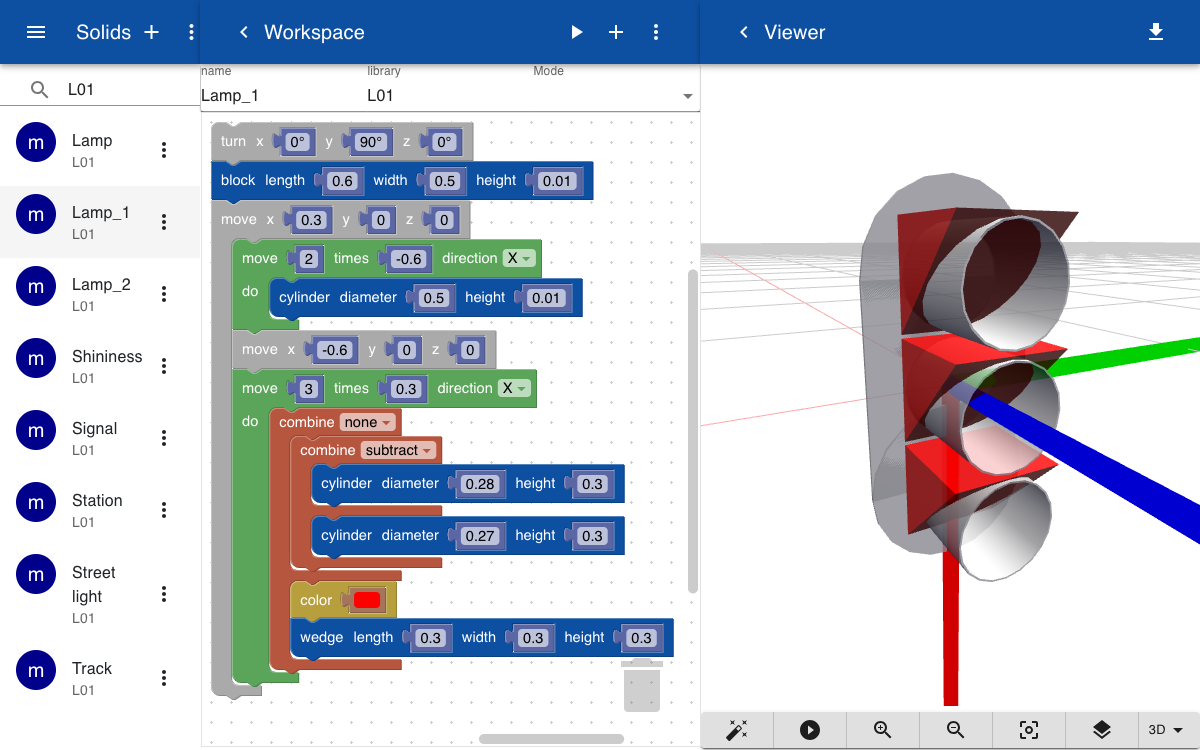
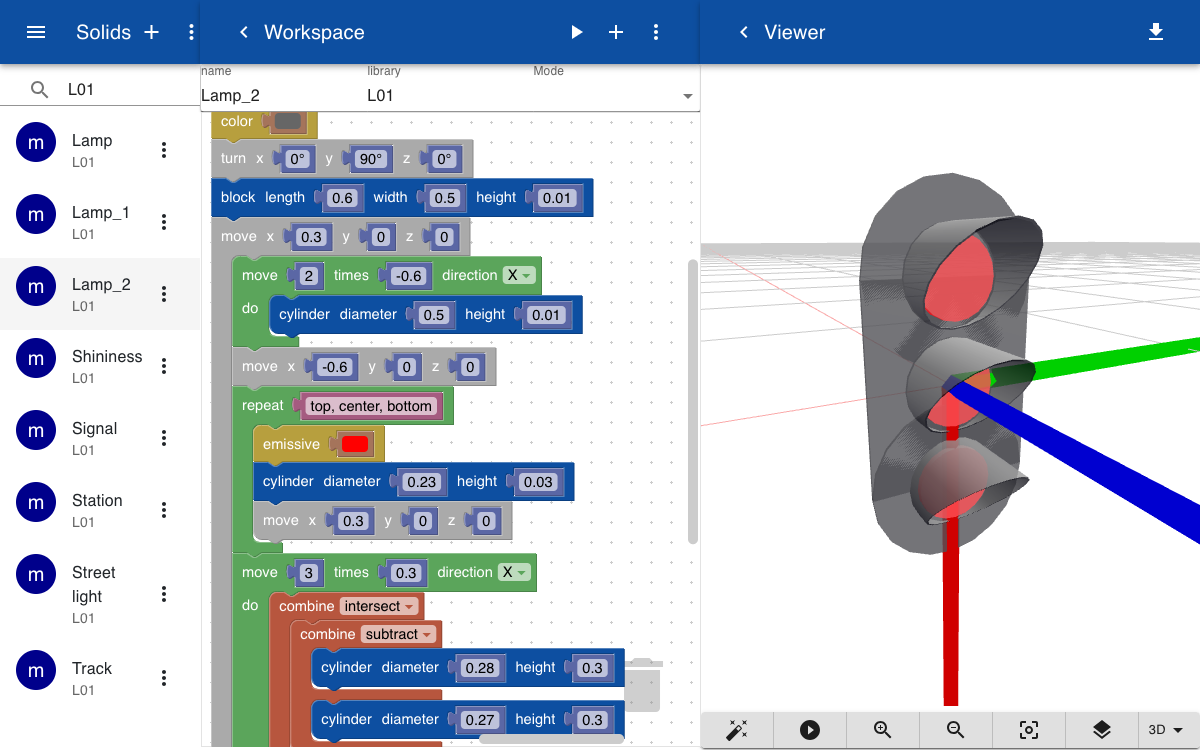
The three lights are created with a repeat statement that includes the text top, center, bottom. This creates three objects that are named top, center, and bottom. These names are used to link the topics to the geometry in the solid. The final solid is stored as Lamp.
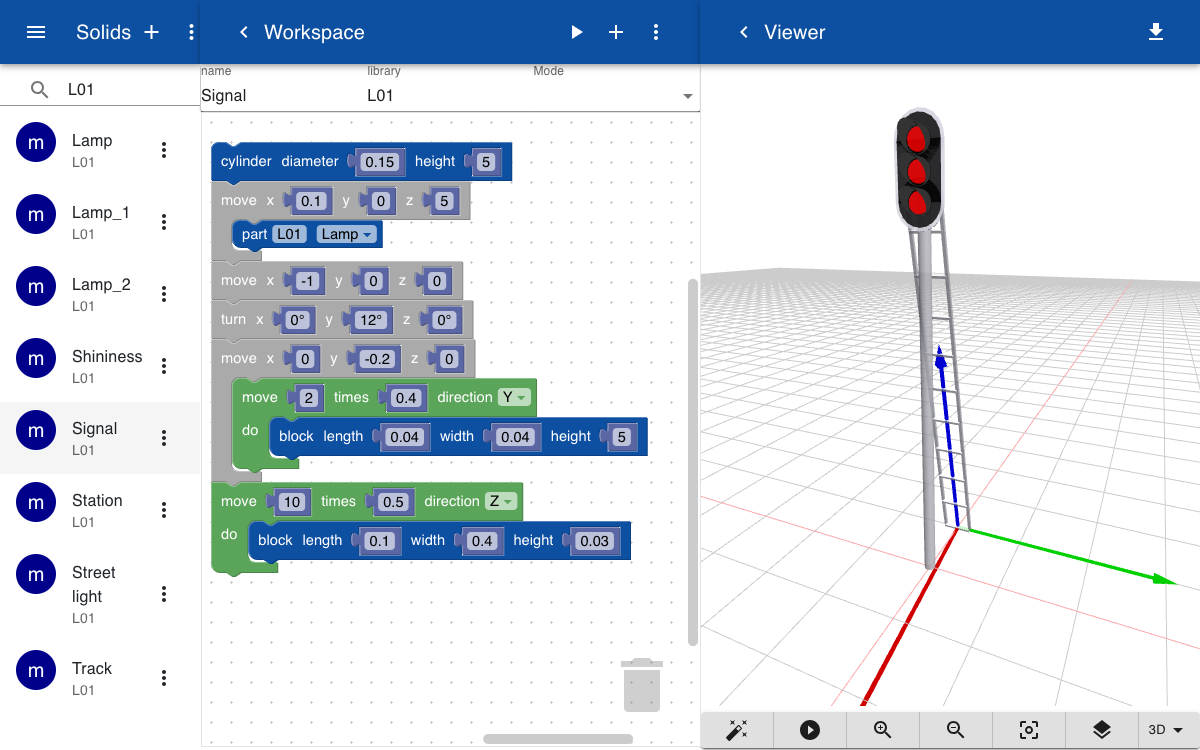
The signal is created by adding the Lamp to a tall cylinder that represents the pole. The stairs are created by a repeat statement that creates steps. The new object is saved as Signal.
The
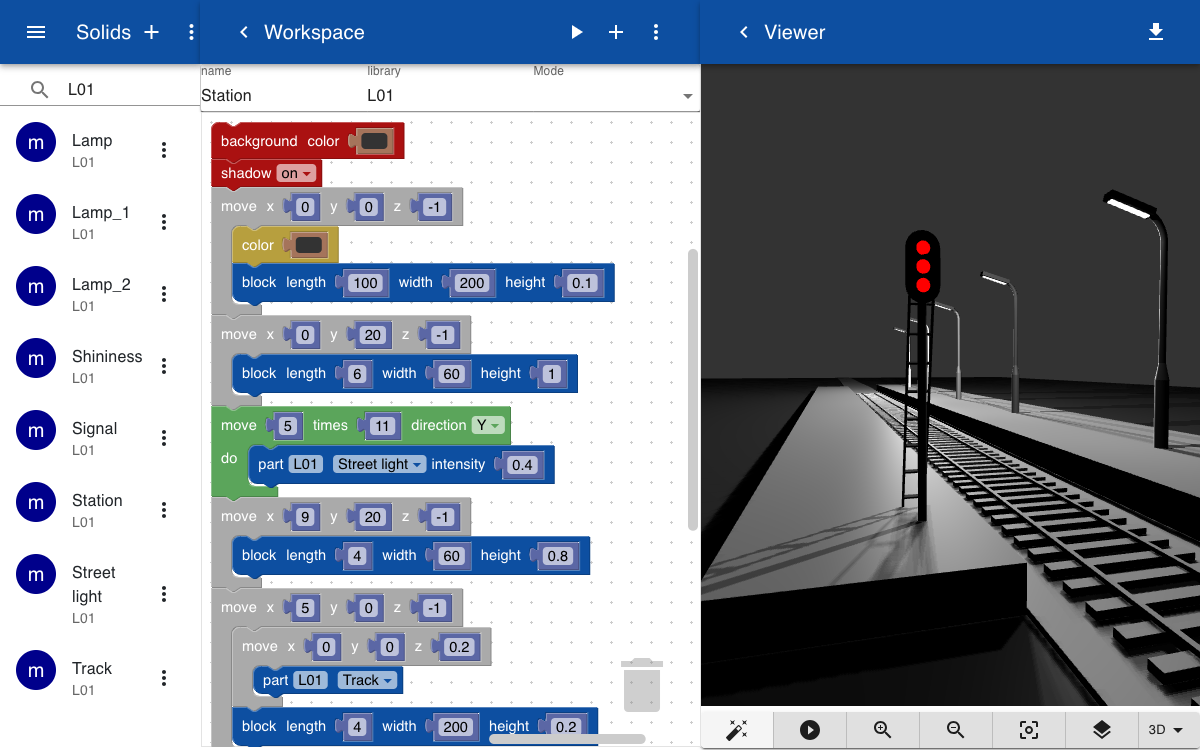
The railway station is created by two large blocks that form the platforms on both sides. The street lights and tracks are created separately and are included. The move blocks are used to arrange the parts on the platform. Finally, the part Signal is included and positioned in the front. Note that the signal only shows the default colors that have been defined in the model. Next, we will connect the color of the lights to the value of the topics.
Topics
The main topic railway.station has a subtopic geometry that includes the name of the GLTF file. It also has a subtopic signal that indicates the color of the signal. The signal has three sub topics, that represent the top, center and bottom lights. Each light is connected to a node in the GLTF model that has the geometry of the light, in this case a small cylinder that emits light. Each light also has a subtopic that contains the value of the color of the light. You can specify the color of each light by entering a JavaScript expression that may include values of other topics. In this case, we use a ternary expression that looks up the value of the topic railway.station.signal. If the value matches the color defined in the topic the light will emit that color, otherwise it is turned to black.
railway.station.name = Station L01
railway.station.geometry = Station.gltf
railway.station.signal = clear

railway.station.signal.top.node = Signal_Lamp_top
railway.station.signal.top.emissive = railway.station.signal === 'clear' ? 'green' : 'black'

railway.station.signal.center.node = Signal_Lamp_center
railway.station.signal.center.emissive = railway.station.signal === 'caution' ? 'orange' : 'black'

railway.station.signal.bottom.node = Signal_Lamp_bottom
railway.station.signal.bottom.emissive = railway.station.signal === 'stop' ? 'green' : 'black'
Form
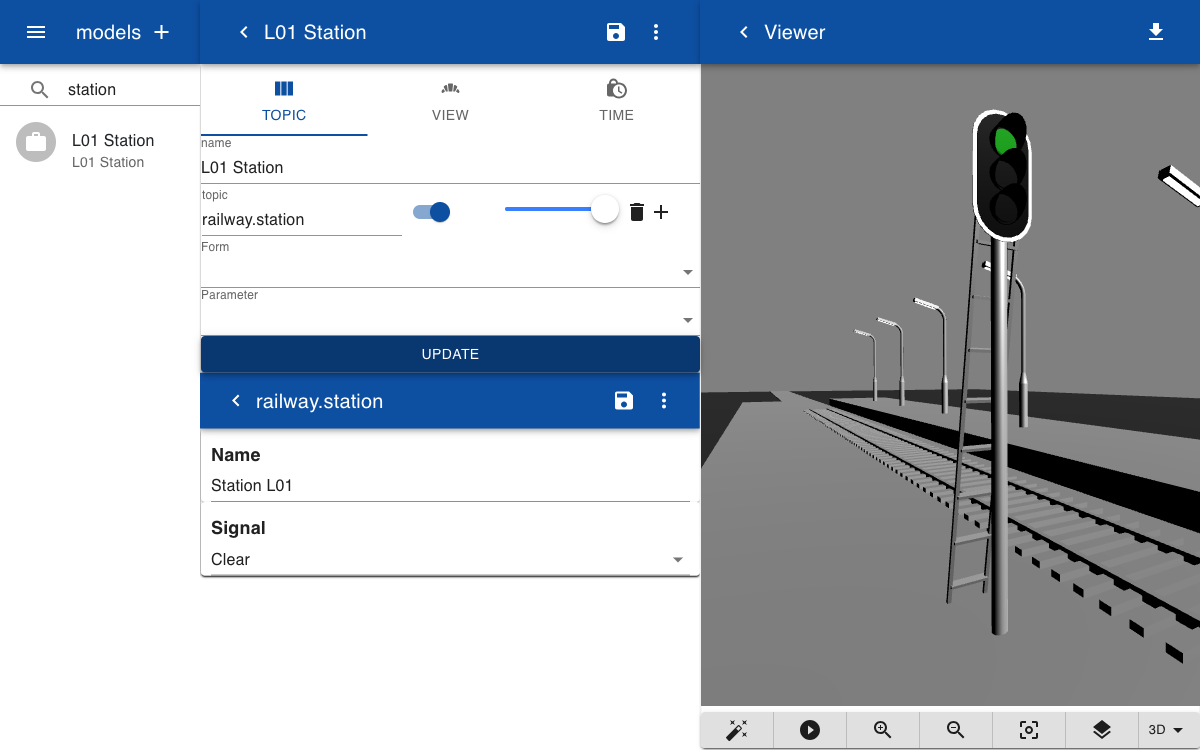
To control the value of the signal we create a form for the railway station that includes the color of the signal.
Station

Name

Signal
[
clear,
caution,
stop
]
Model
Create a new model and include the main topic railway.station. The model opens and the three lights of the signal are recolored so that only the center light shows orange. When you double-click on the sign the form opens. Select the edit icon and change the value to red or green. When you update the model the center light turns off and one of the other lights will be activated.
Explanation
The lighting is controlled by setting the emissive color property of nodes in the GTLF file. The color can either be a string like purple or a hexadecimal value such as #ff00ff. When rendering the model, a lookup is made for the name of each node in the 3D model to see if there is a topic ending with .node and a value identical to the name of the node. If this is true, a topic is searched with the same parent topic that ends with emissive. For example, the following topics would set the emissive color of a node named Signal_Lamp_top to blue:
railway.station.signal.top.node = Signal_Lamp_top
railway.station.signal.top.emissive = blue
Instead of entering a fixed color, you can also set the color via a JavaScript expression that takes the value of another topic. For example, we can use a single topic Signal to control the value of the emissive property:
railway.station.signal = orange
railway.station.signal.top.emissive = railway.station.signal === 'clear' ? 'green' : 'black'
The chart below shows how the topics and subtopics are linked to the nodes in the GLTF model.