Dynamic coloring
Instead of using a JavaScript expression that defines the color we can also use a color table defined in a form. The advantage of this method is that we can dynamically switch between various parameters defined in the form. In this example, we have a form that displays the temperature and humidity of an area.
Topics
Each area in the model has three topics: a link to the name of the node in the GLTF model, temperature, and humidity. These parameters can be obtained automatically from IoT devices and imported via a connector.
site.B01.geometry = Building.gltf
site.B01.area_1_a_Living.temperature = 22
site.B01.area_1_a_Living.humidity = 66
site.B01.area_1_a_Living.node = IcfSpace_1_a_Unit_Living
site.B01.area_1_b_Living.temperature = 25
site.B01.area_1_b_Living.humidity = 30
site.B01.area_1_b_Living.node = IcfSpace_1_b_Unit_Living
Form
Create a new form and include two controls for temperature and humidity. In the form, you specify how the values are mapped to color names. For example, in the form below a temperature of 15 degrees is converted to blue.
Apartment Room

Reference
|6

Name
|6

Temperature
[0|18:blue,18|21:green,21|24:orange,24|30:red 00]

Humidity
[0|50:grey,70|100:blue 00]

Volume
[0.00 m3]

Area
[0.00 m2]
Model
Create a new model and specify the topics you want to visualize, for example, site.B01`. All subtopics that contain the references to the geometry and nodes are included. Now select the form you want to use for visualization and select one of the parameters in the form. If you change the parameter, the model is automatically updated. If you click on one of the areas in the model the form that shows the parameters of that area is opened.
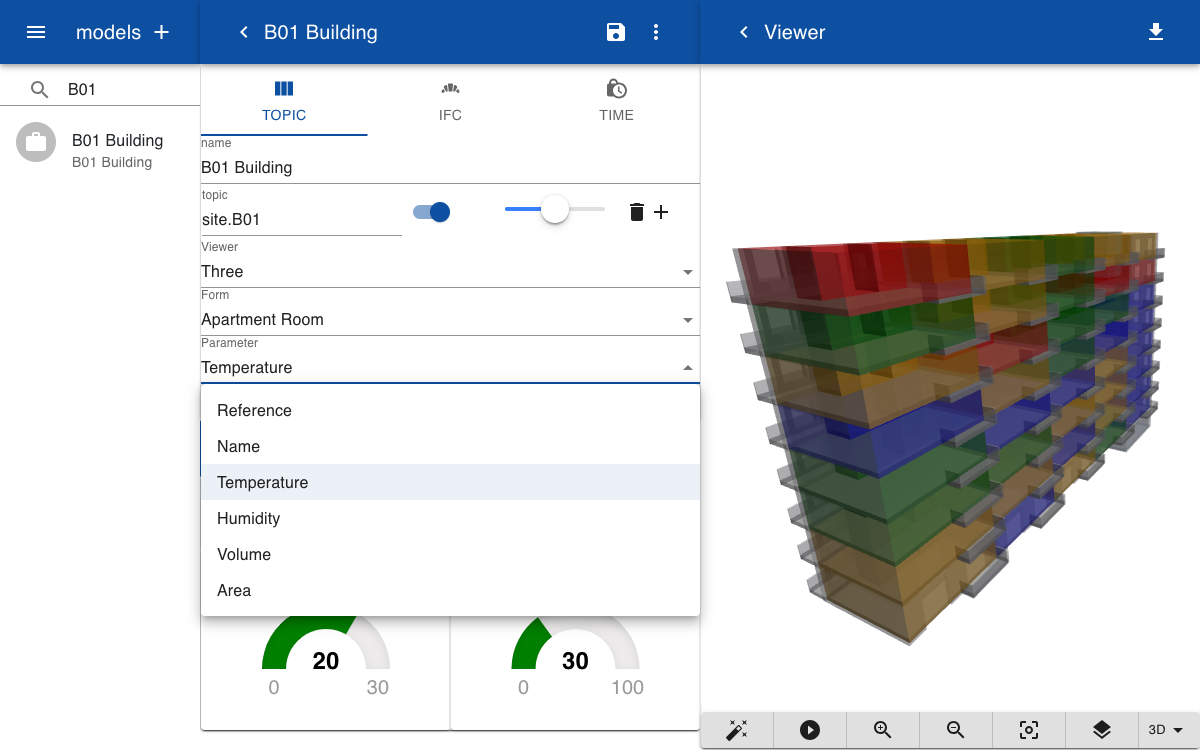
You can now change the coloring scheme by selecting another parameter from the drop-down menu. In this case, we select the parameter Humidity. The areas are now colored according to the current value of the Humidity subtopics of the area and the color ranges defined for the humidity parameter. You can select any parameter defined in the form that has a numerical value and a color mapping.
Explanation
To apply dynamic coloring the topics are connected to the GLTF model and the nodes in the model. The geometry subtopic defines the name of the model and the node subtopic defines the name of the node. You can then specify the subtopics that you want to visualize. For example, occupancy, CO2 level, or temperature. The parameter values are converted to colors by using a form that includes color mapping.