Multi variate
A Multivariate Neural Network is a model designed to handle multiple input features (independent variables) simultaneously to predict one or more output values. For example, to predict the energy use for heating a building you can add input features for outside temperature, inside temperature (thermostat), and wind speed. The advantage of this prediction method is that it can make more reliable long term predictions if you have good forecasts for the input values.
Dataset
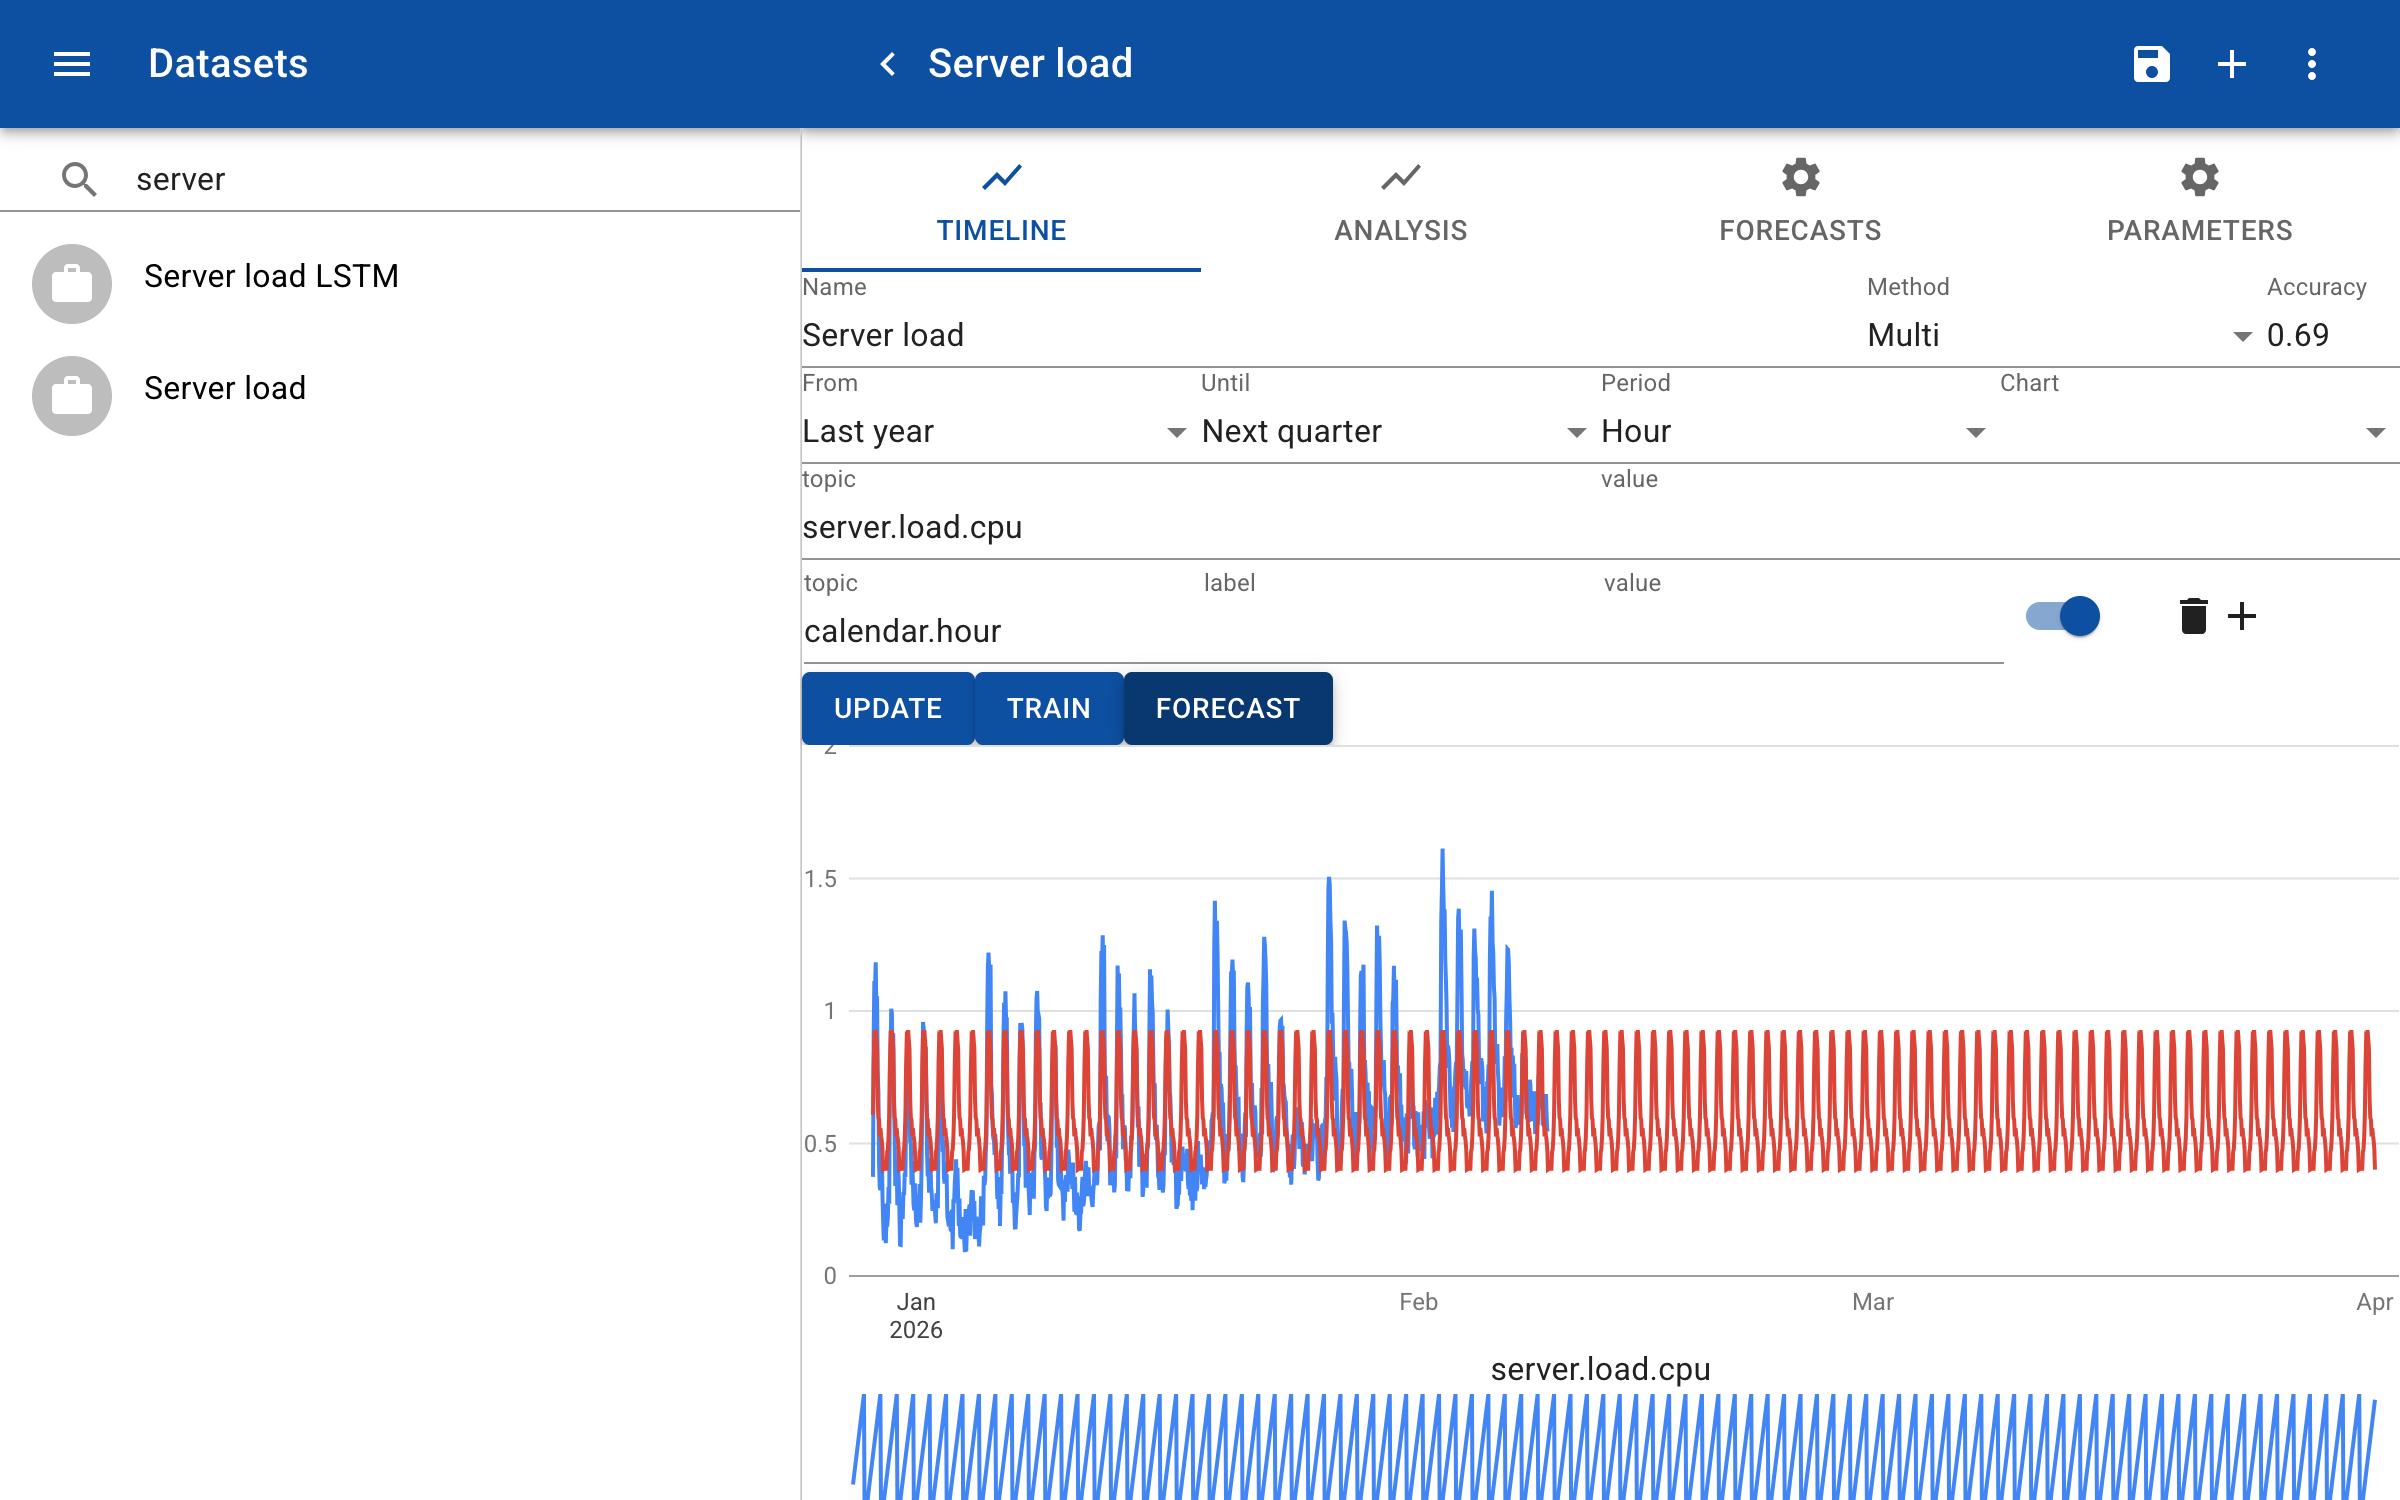
In this example we predict the CPU load based on the value of other inputs: the hour of day, the day of week and the number of days in time since 1970. The input calendar.hour helps to predict the daily pattern of high usage around 10:00 AM and low load at night. As you can see below, the model has picked up the daily pattern of high usage during the day and the predictions remain constant further in the future, unlike with the 'LSTM' model.
You can enter additional input features to make the prediction more accurate.
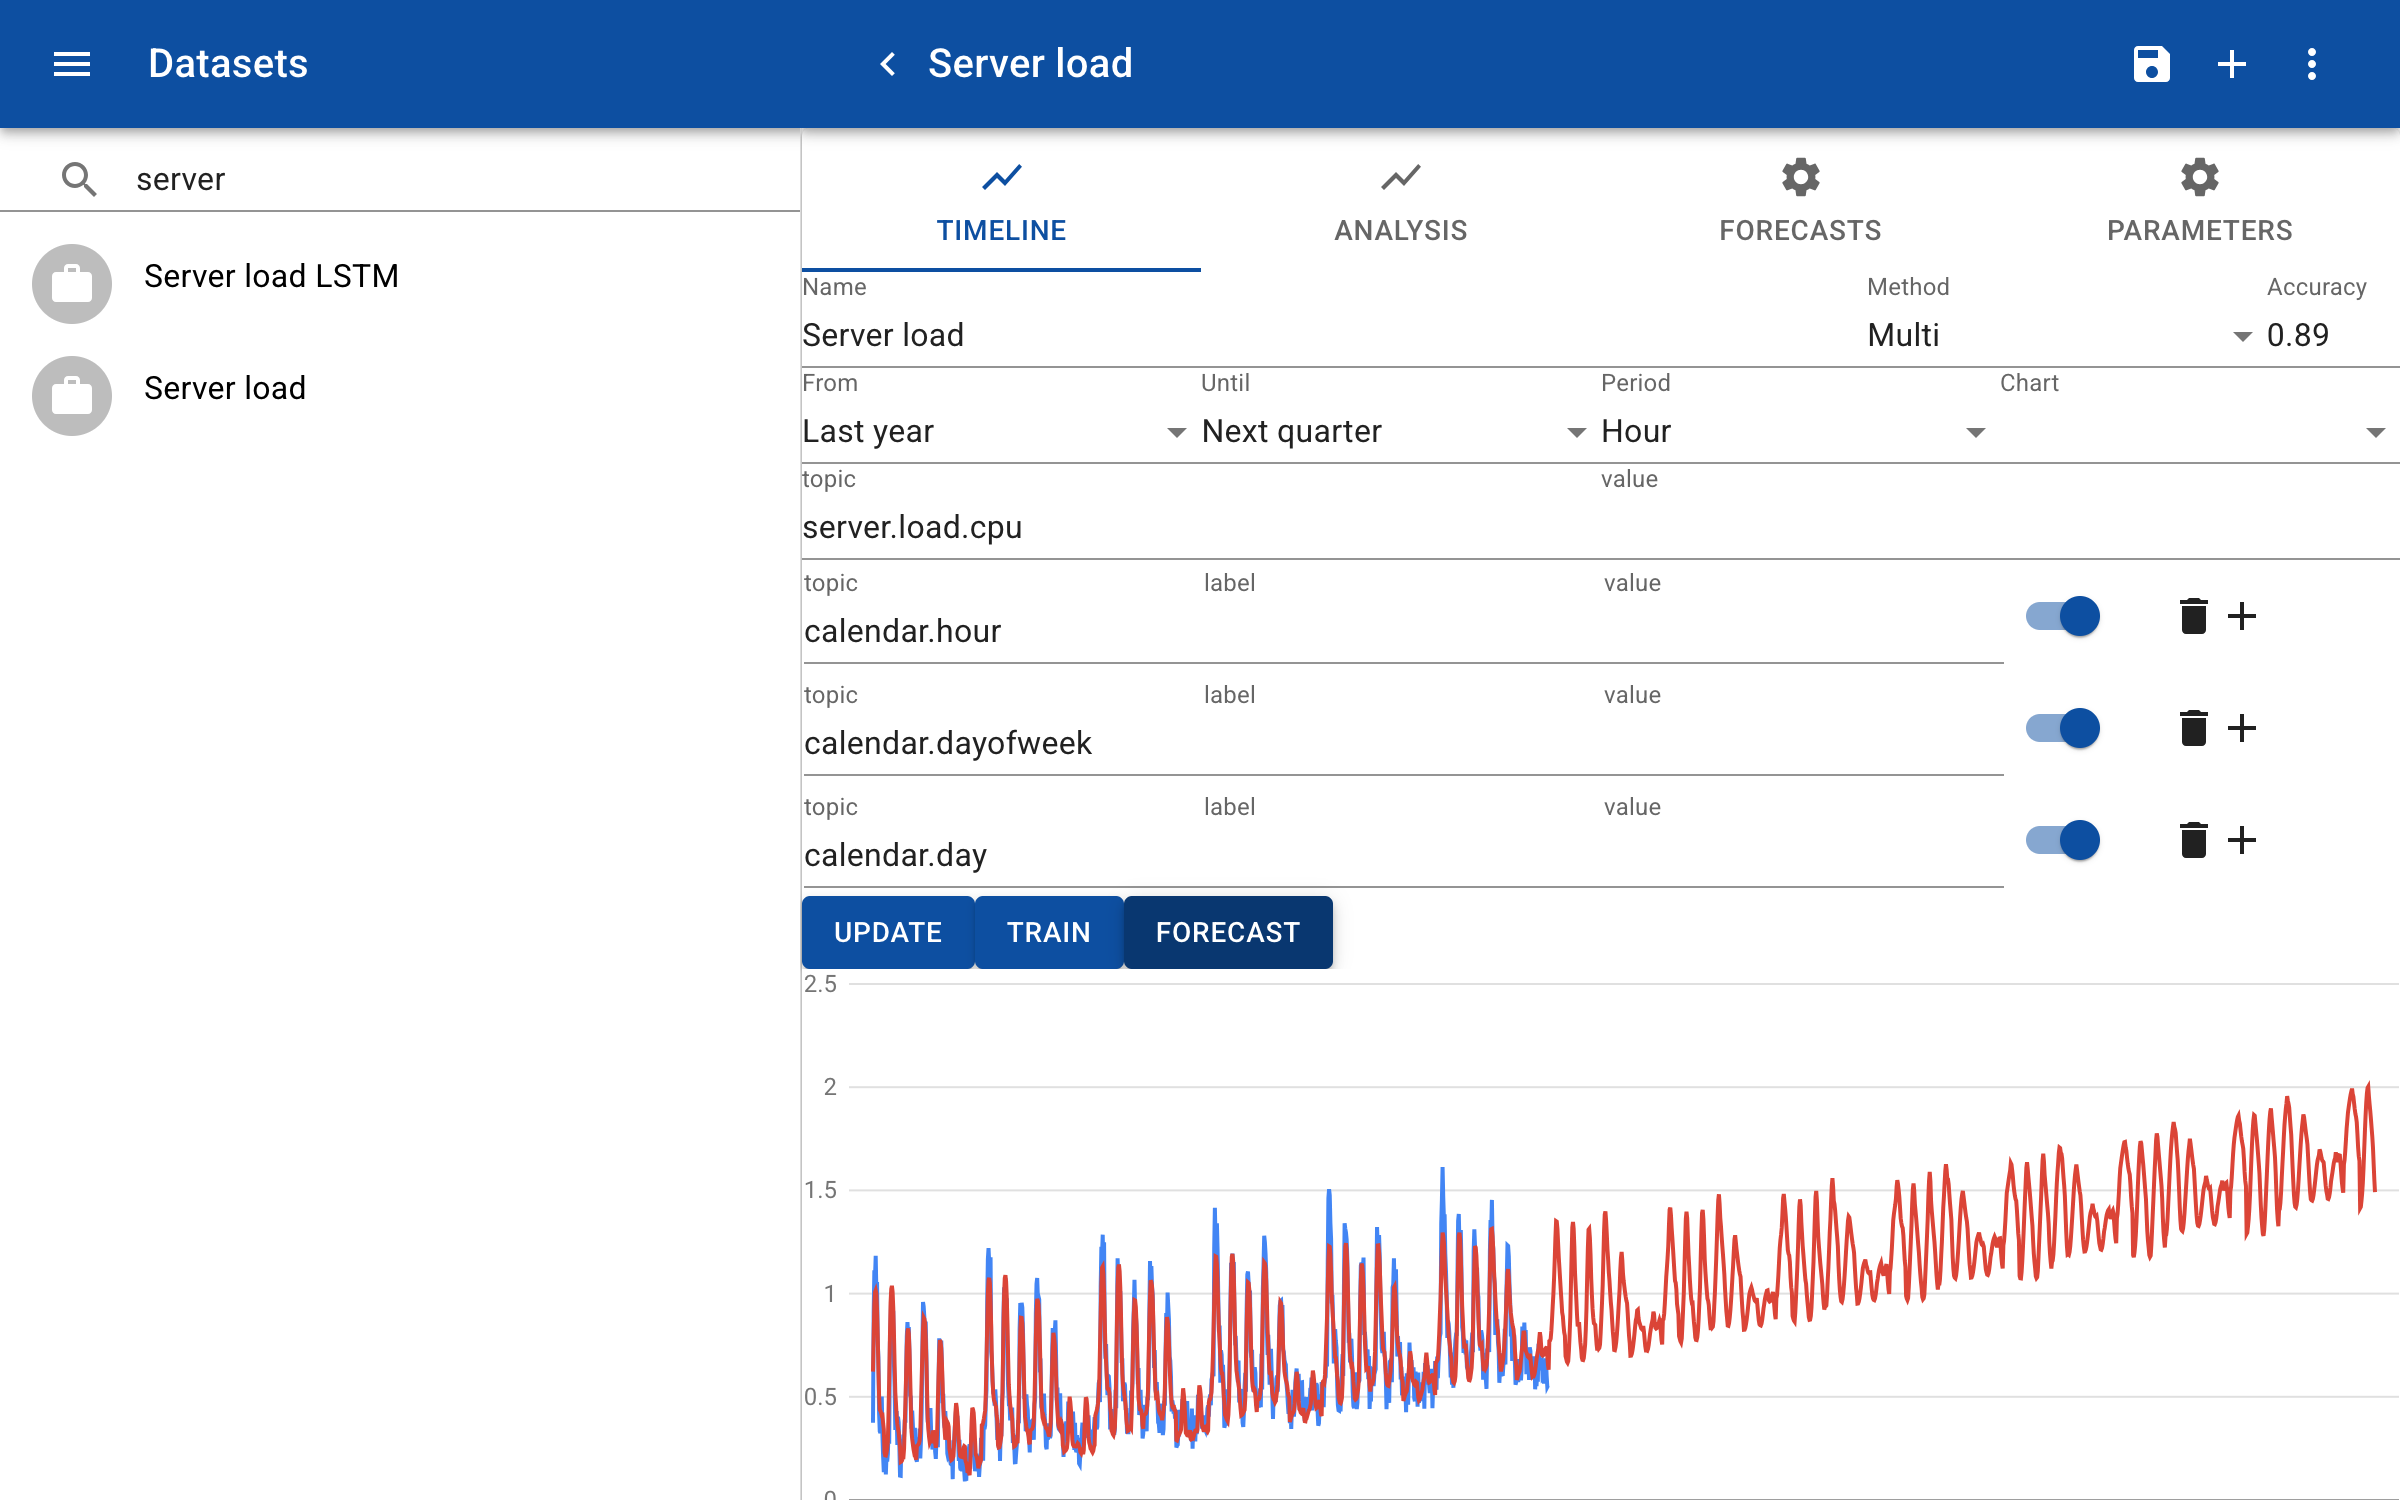
The input calendar.dayofweek helps to predict the weekly pattern with high loads on weekdays and low loads in the weekends. The feature days helps to detect the overall increase of load over time, for example, due to increased number of users. With these features the accuracy has increased to 0.89.
Script
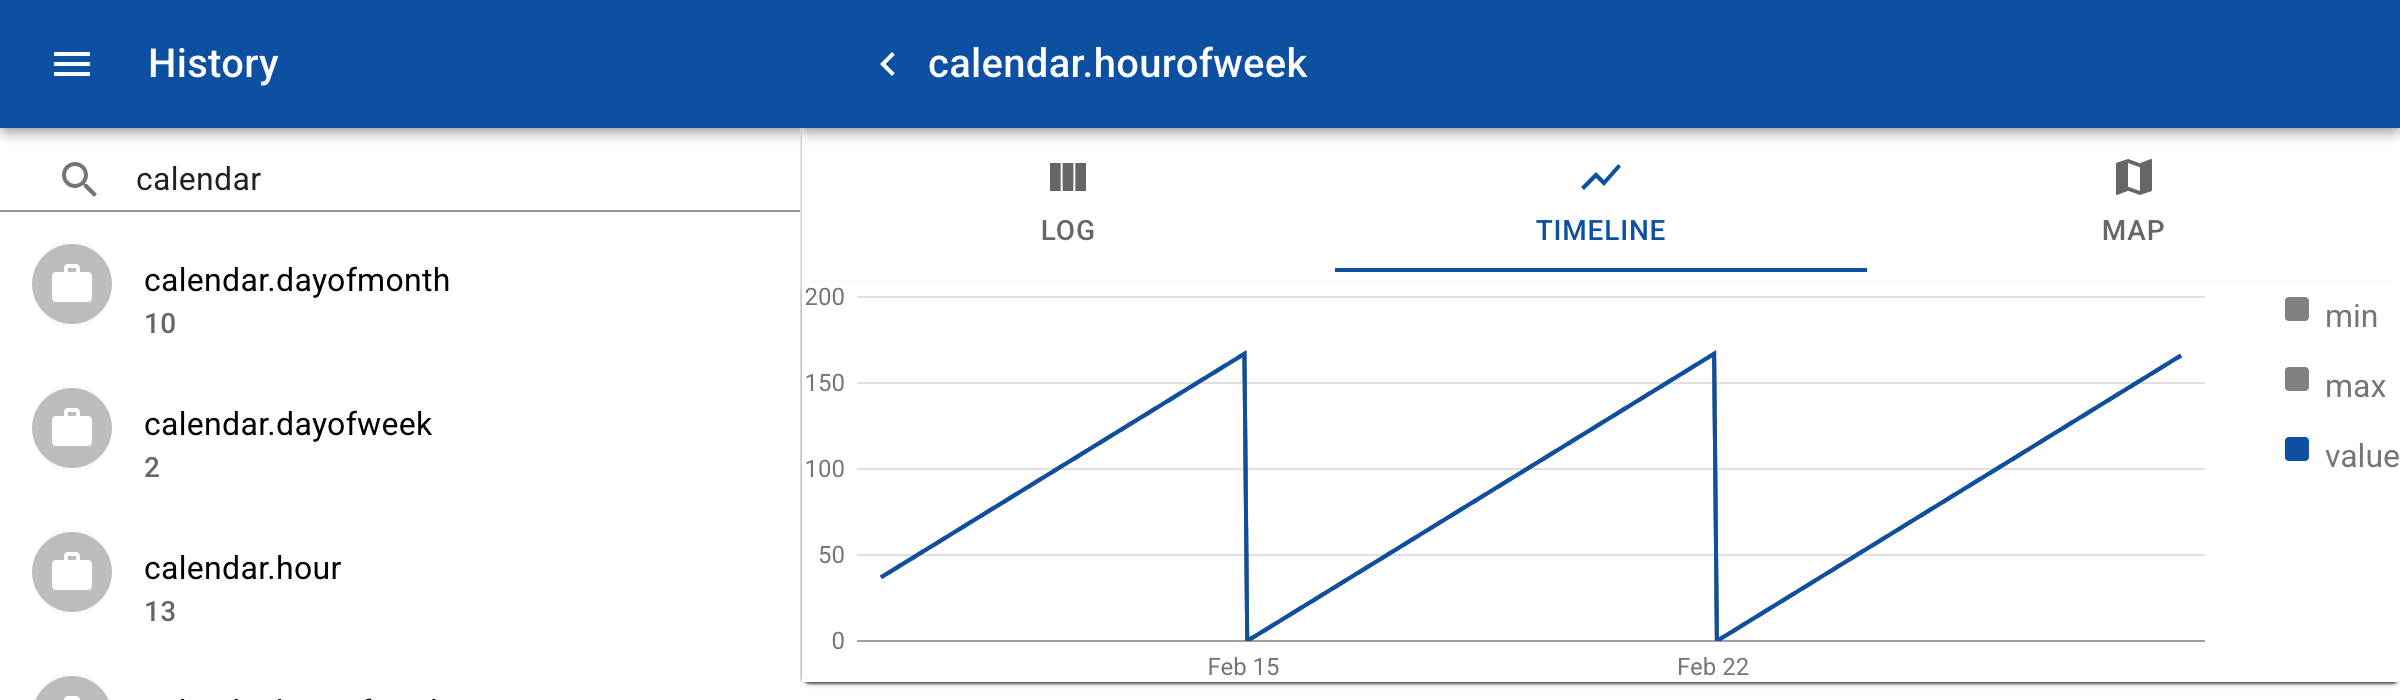
In this example we use special topics where the value is defined by a script. Create a new topic and click on the tab Script. Here you can enter a JavaScript function that returns a value based on the time input that is provided during the query of a time range. So instead of importing a CSV file with values, the values are dynamically generated.

To view the result go to History and search for the topic calendar.hourofweek. Enter a time range from Now to Next month and click on the tab Timeline.
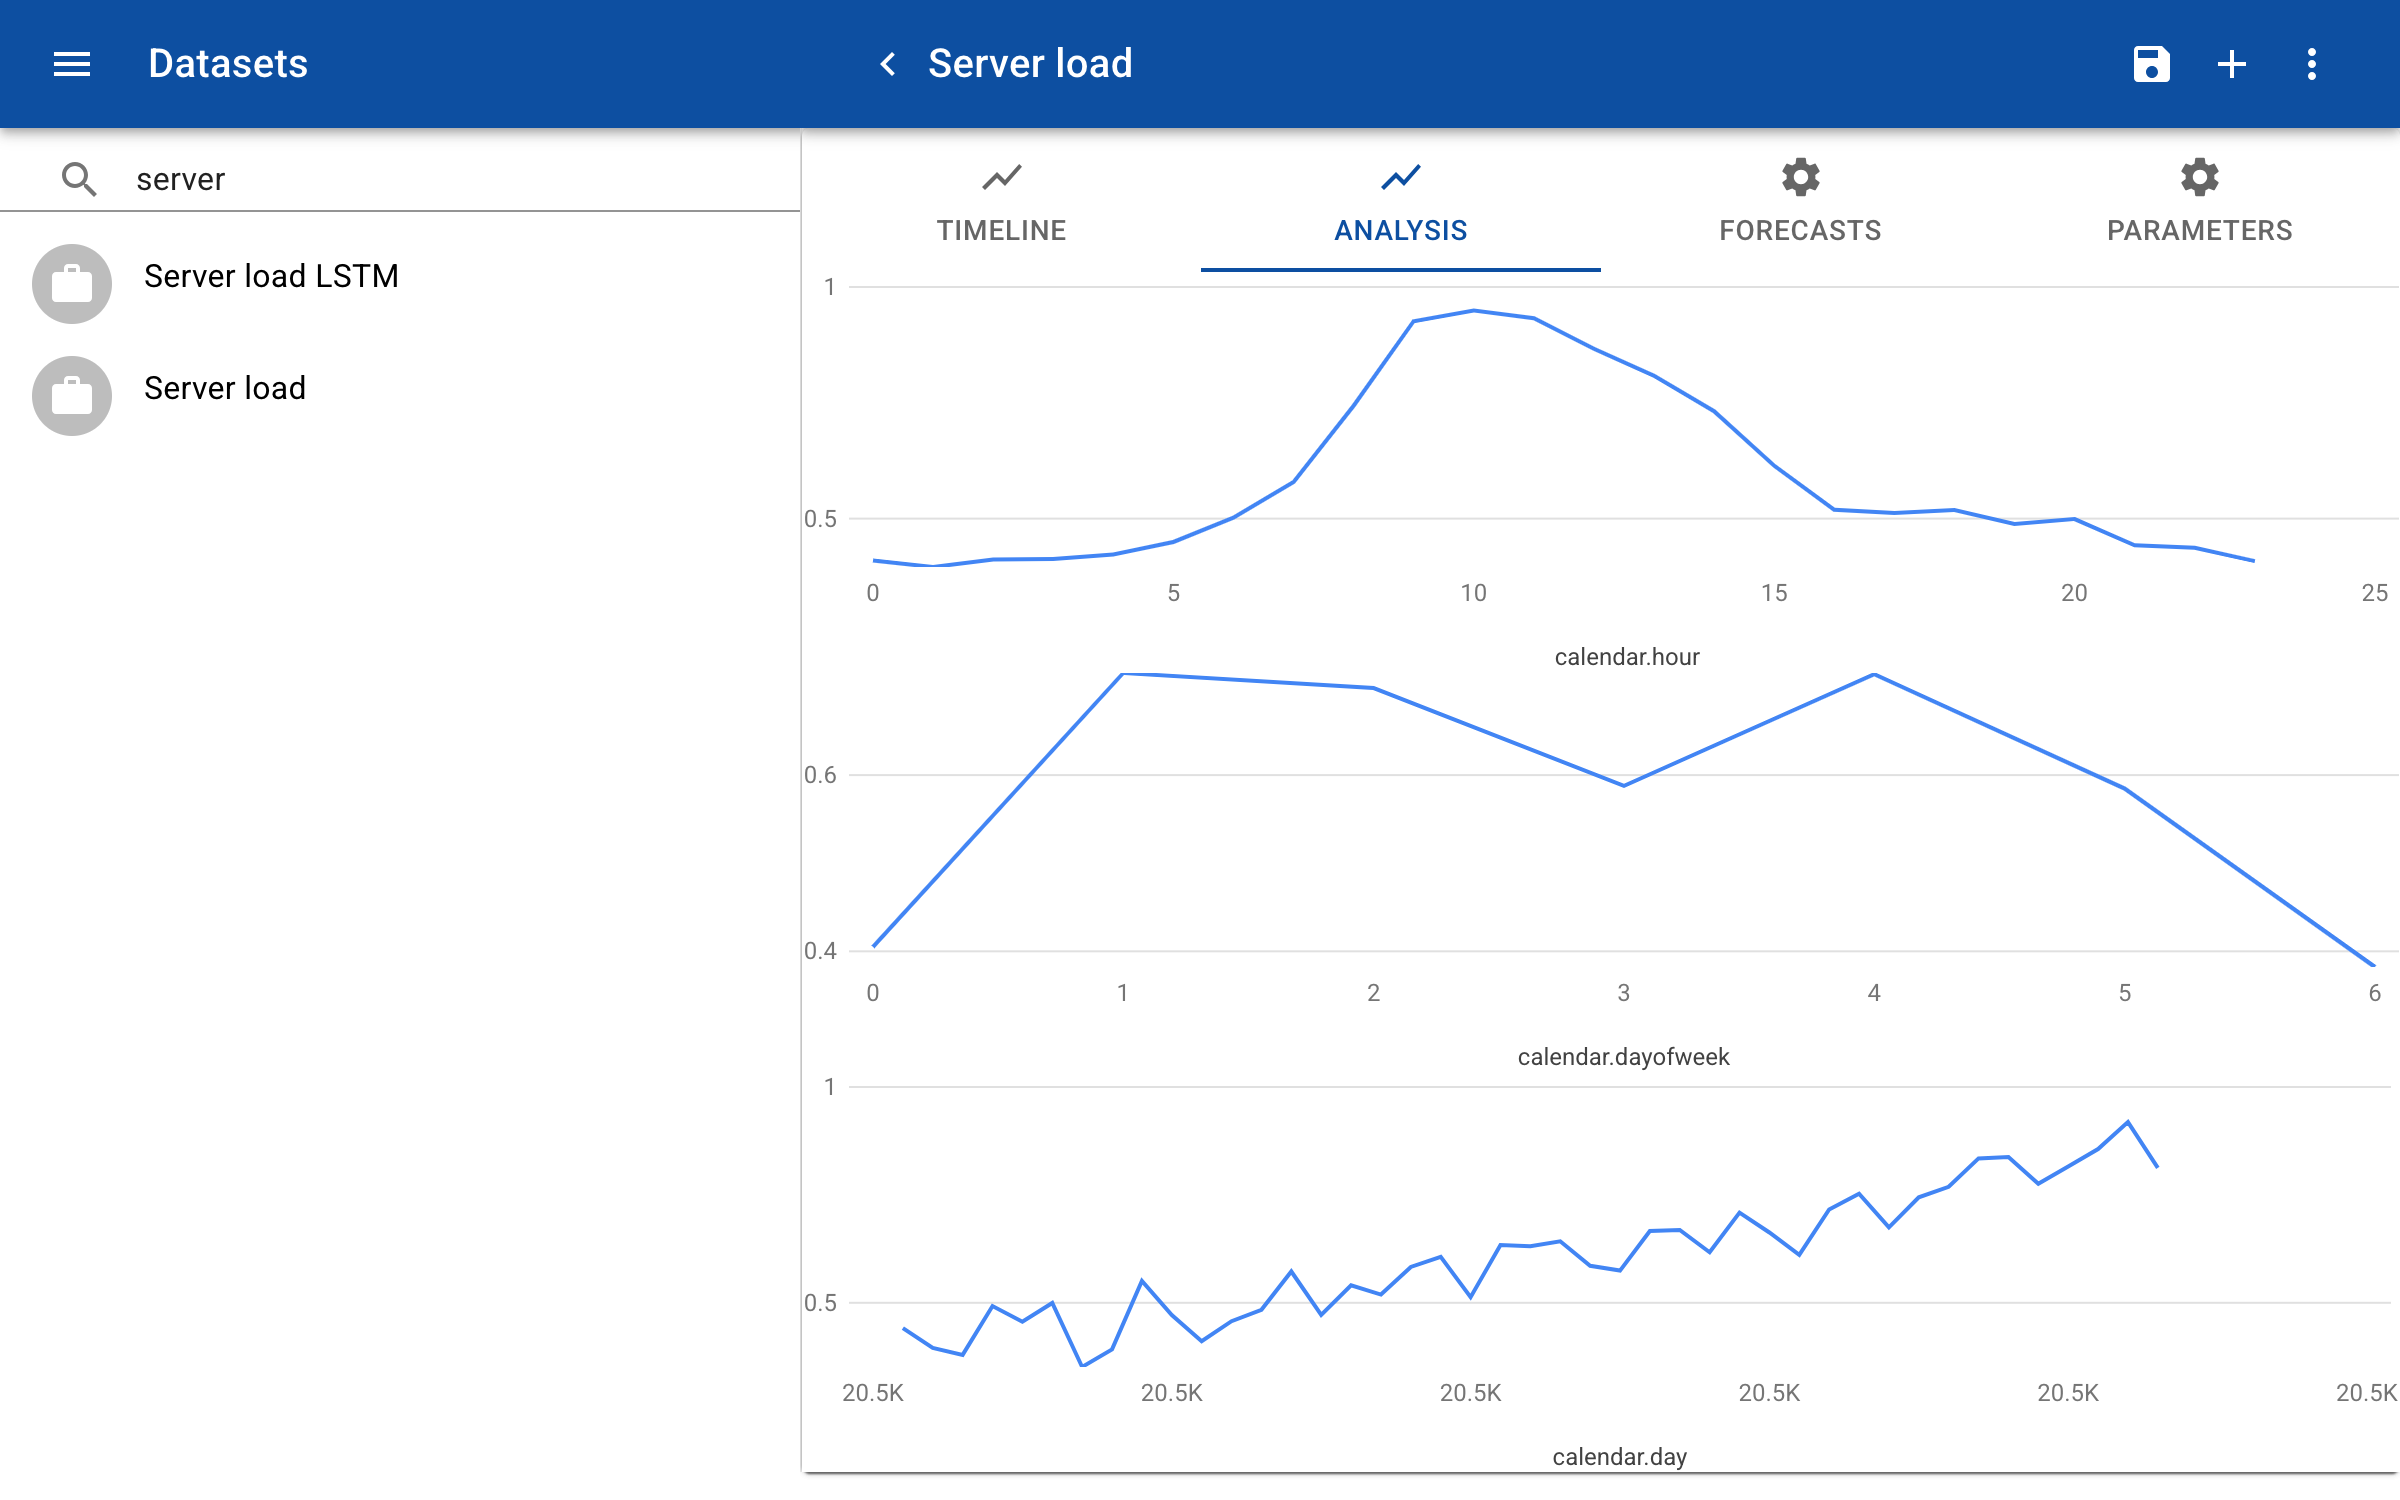
Analysis
To analyze the influence of each of the inputs on the prediction you can click on the Analyze tab. The tab shows a chart for each of the inputs. The horizontal axis shows the range of values in the input data, for instance 1-7 for the number of the day in the week. The vertical axis shows the predicted value for each data point. The predicted value is calculated by running multiple predictions for each value on the horizontal scale and random values for the other input features. For example, to predict the load at 10:00 AM the predictions are generated with random values between 0 and 6 for the day of the week. The average of all these predictions is calculated.