Cesium
Cesium is a platform for displaying 3D geospatial data like Google Earth. It is designed to combine Geographical Information Systems (GIS) with Architecture Engineering and Construction (AEC) applications. This means that you can navigate a digital map and zoom in to a building downs to the level of building elements such as doors and equipment. You can use Cesium to show 3D object on a map where their color and shape depend on IoT parameters. For example, you can show the building occupancy in a campus using colors or show the location of street lights that have a defect. Cesium can be applied for complex 3D structures such as refineries, plants and smart cities.
Topics
In this example we create 5 buildings with some properties and a geographical location. Instead of using a file with a GLTF or IFC model we now use the build-in geometric primitives like box, cylinder and sphere. We also define a topic for the position in GPS coordinates and the orientation of the building.
campus.parking.p1.name = blue
campus.parking.p1.geometry = box(61, 32, 50)
campus.parking.p1.position = 51.412549786755015,5.454481803707153,0
campus.parking.p1.orientation = 17

campus.parking.p2.name = blue
campus.parking.p2.geometry = box(61, 32, 50)
campus.parking.p2.position = 51.41277531843427,5.455779596874186, 0
...
Model
Next we create a new model with name Campus and add three topics campus.parking, campus.office and campus.restaurant. Since we want to show the location on the earth surface we select the Cesium viewer. x
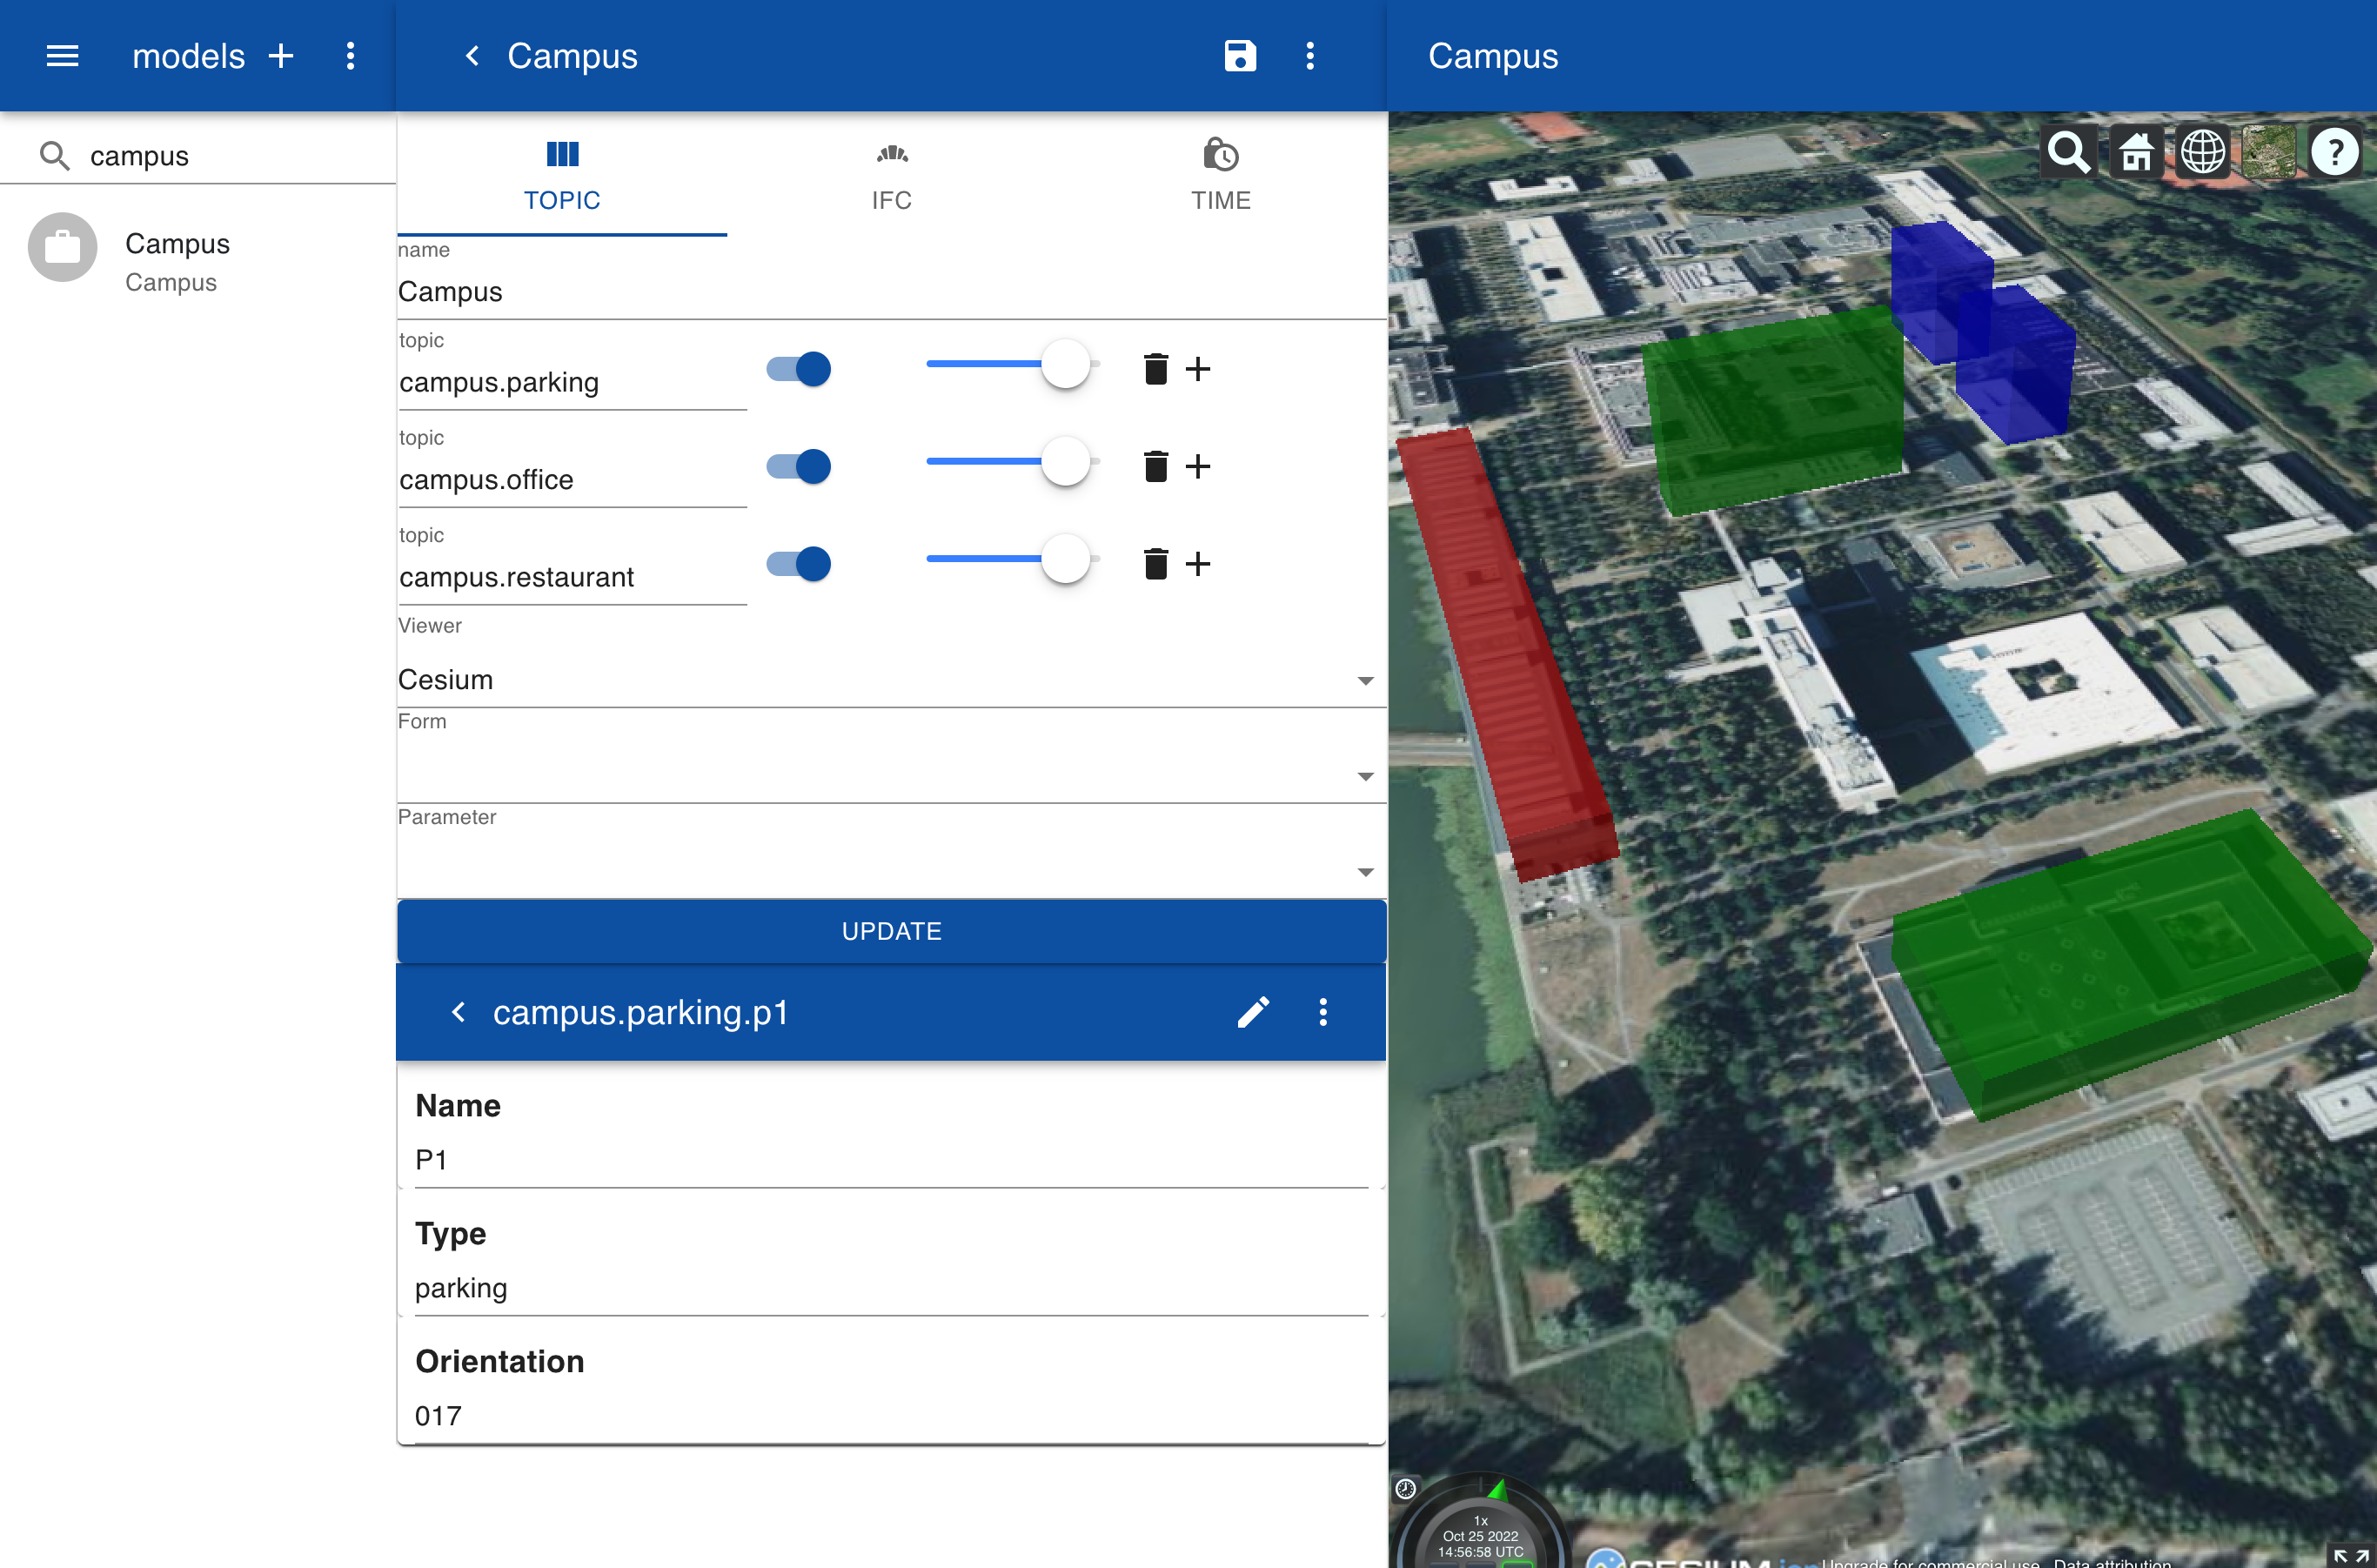
You can toggle the switches for the topics to turn the display on or of or change the transparency with the slider.
Form
To display the basic information on the builings you can add the following form:
Campus

Name

Type

Orientation
[000]
If you click on a building the form is displayed and you can change the values such as the orientation.