Machine learning
Machine learning is a form of artificial intelligence (AI) where algorithms can detect trends and make forecast based on data. An example is a greenhouse farmer who needs to predict the amount of energy that is needed for the coming three days based on the forecasted number of sun hours, outside temperature and month in the year.
Trend analysis
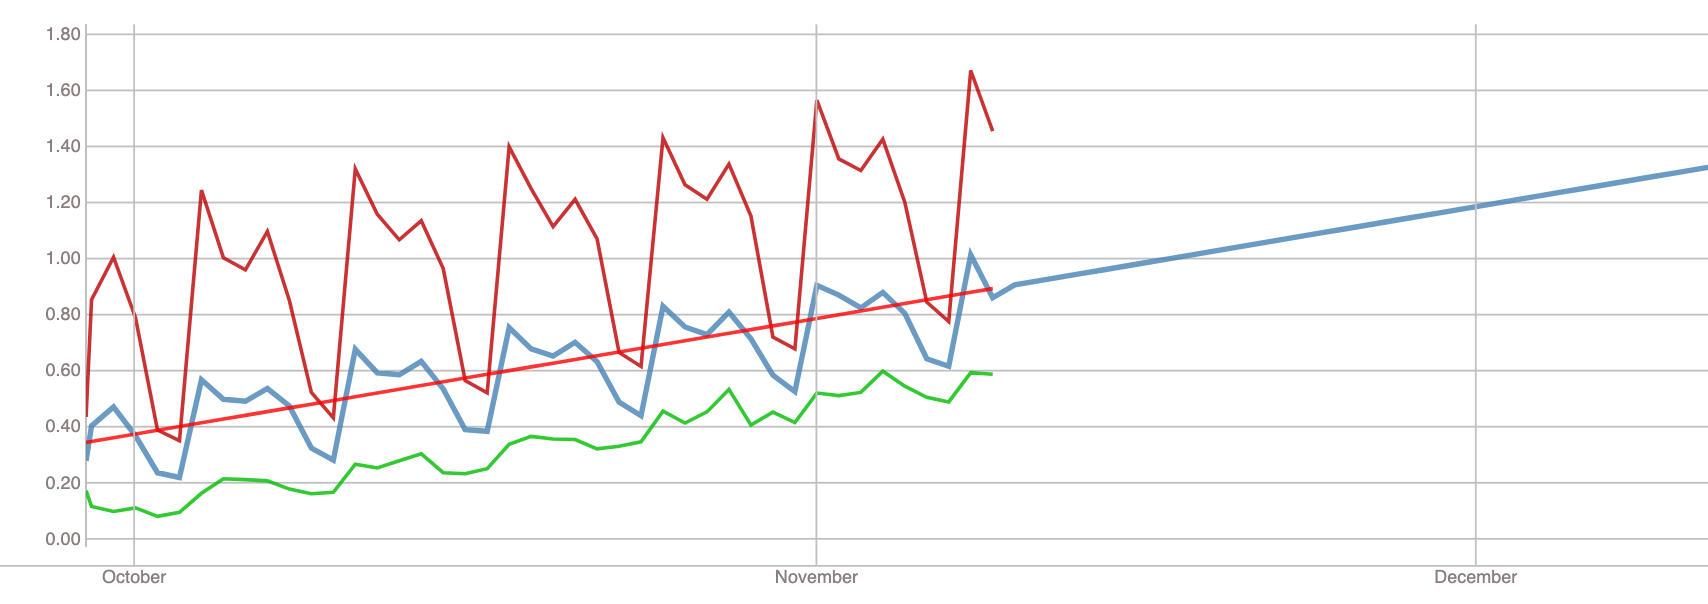
A relatively simple form of data analysis is to aggregate data to extract the minimum, maximum and average values. The chart below shows a CPU load of a server where the green line is the minimum load, the blue line the average load and the red line the maximum load. The values are calculated by aggregating hourly CPU loads by week. The forecast for the average for the coming month is shown in the extended blue line and is calculated by so called 'polynomial regression'. The algorithm tries to fit a straight line, parabola or third-order polynomial in the historical data and extends this function to the future.
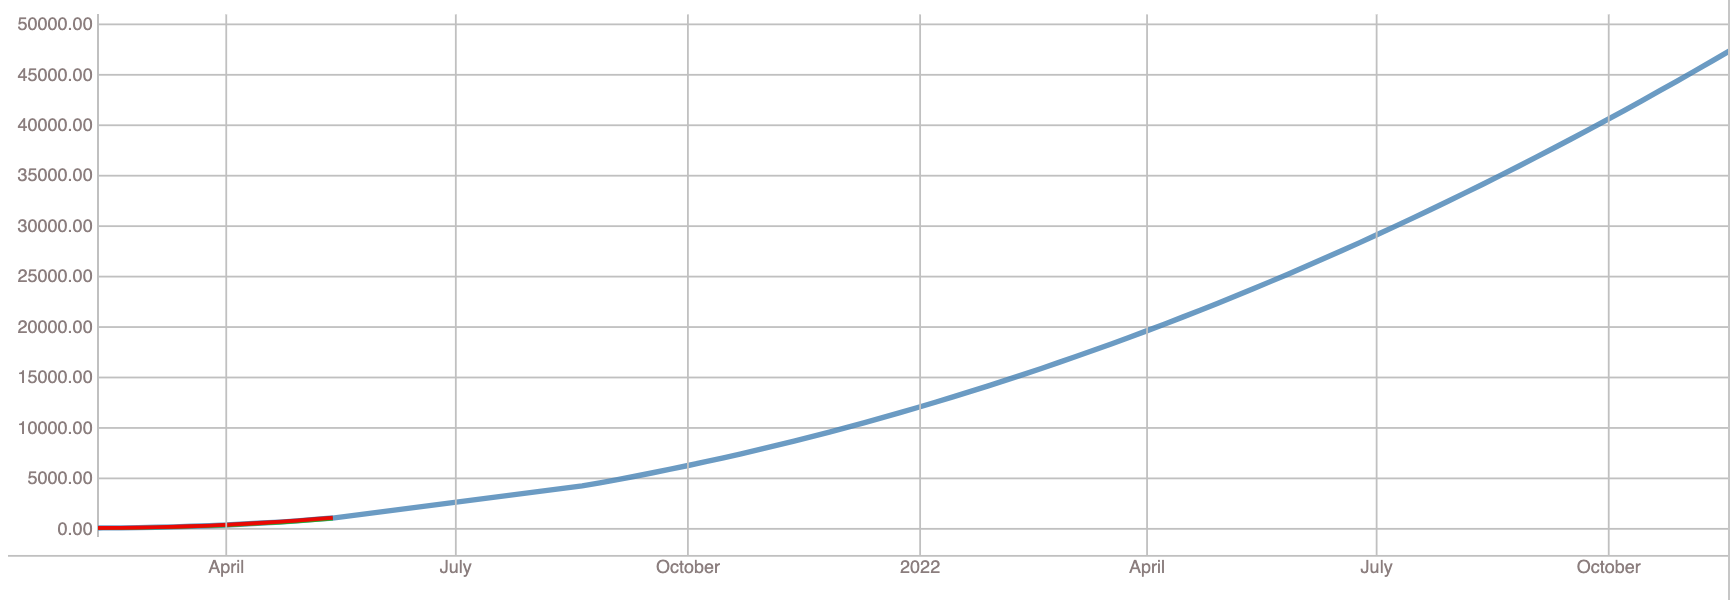
The chart below shows the result of a trend analysis with exponential growth, for example in the case of virus infections.
Relationships
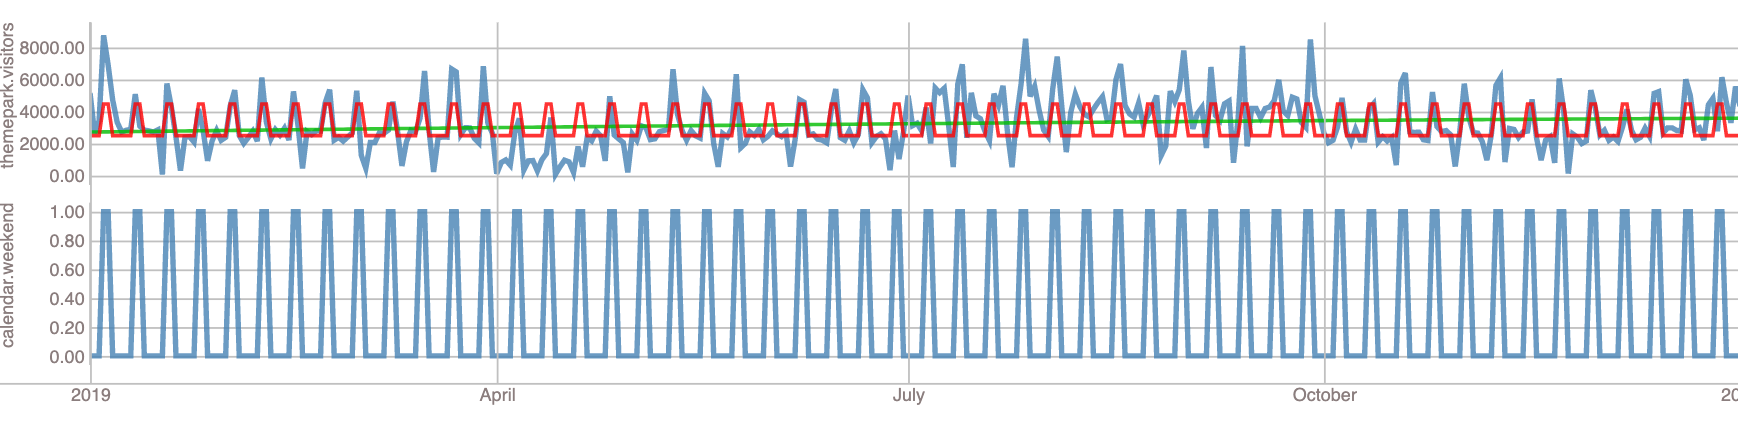
For short term forecast the use of trend analysis is not good enough since it is unable to predict irregular patterns. In the example below the blue lines in the top chart shows the number of visitors in a theme park. The red line shows the predicted number of visitors per day. The prediction is calculated by a neural network that is trained by a single input feature, whether day is in the weekend or not. The predictions match the higher number of visitors but do not explain the higher number of visitors in the summer month or the irregular drops of visitors.
By adding more input features the prediction becomes much more accurate. In the example below the machine learning algorithm also takes into account whether a day is a summer holiday and whether it has rained or not.
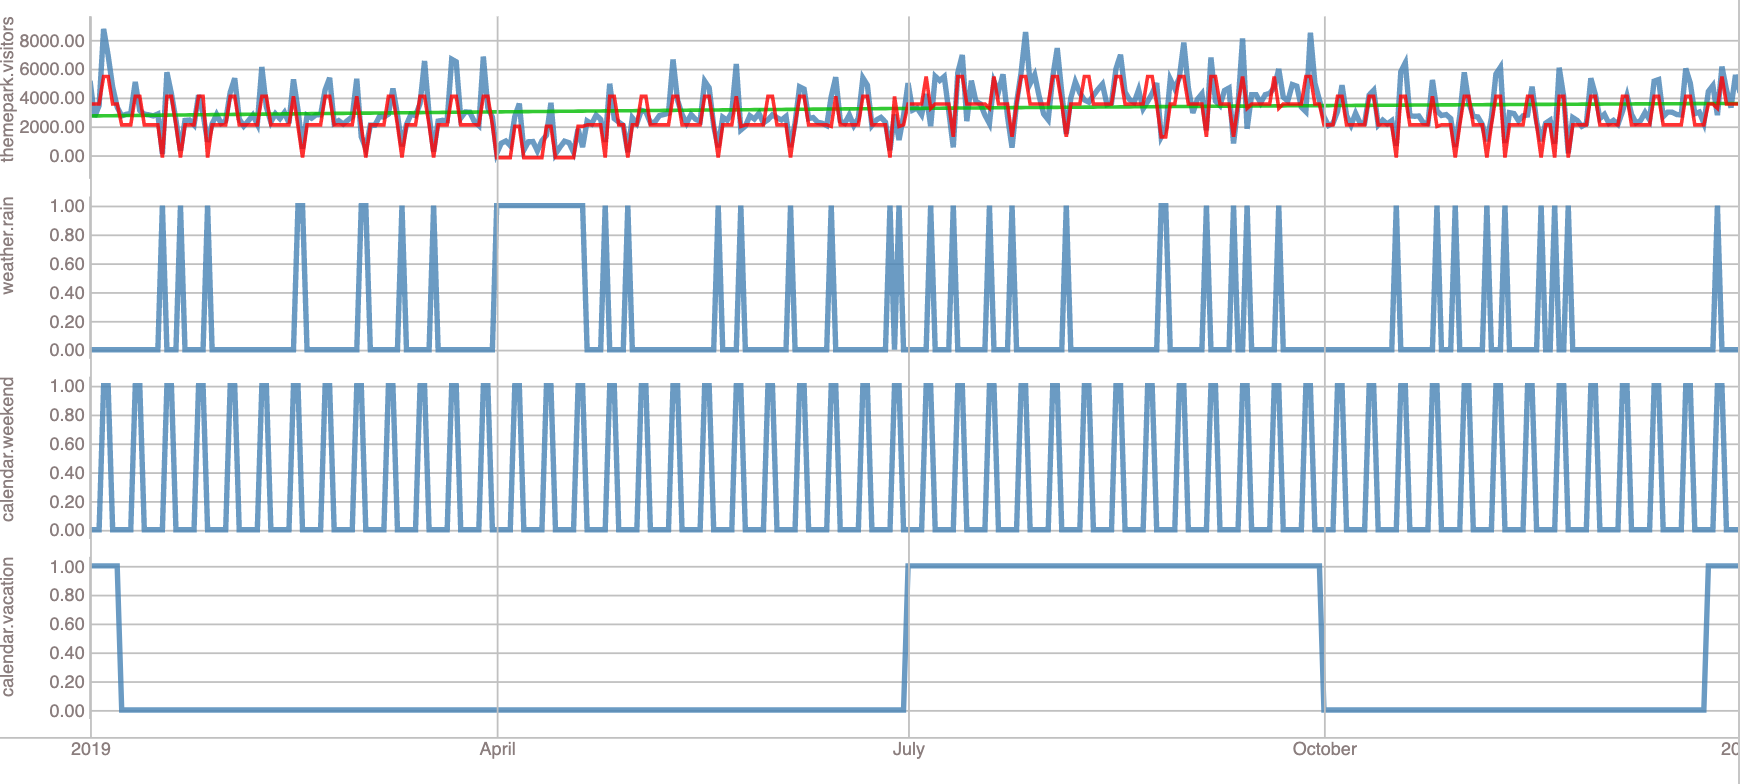
The value of such an analysis is that management of a theme park can predict the number of visitors in the future based on the weather information and days in the year. The estimate can be used to schedule the number of employees that are required to host the guests.
Cyclic patterns
Another example of the application of machine learning is detecting cyclic trends. The example below shows the CPU load of a server per hour of the week. The peak load is between 9:00 and 17:00 on work days but the load is also dependent on the day of the week.
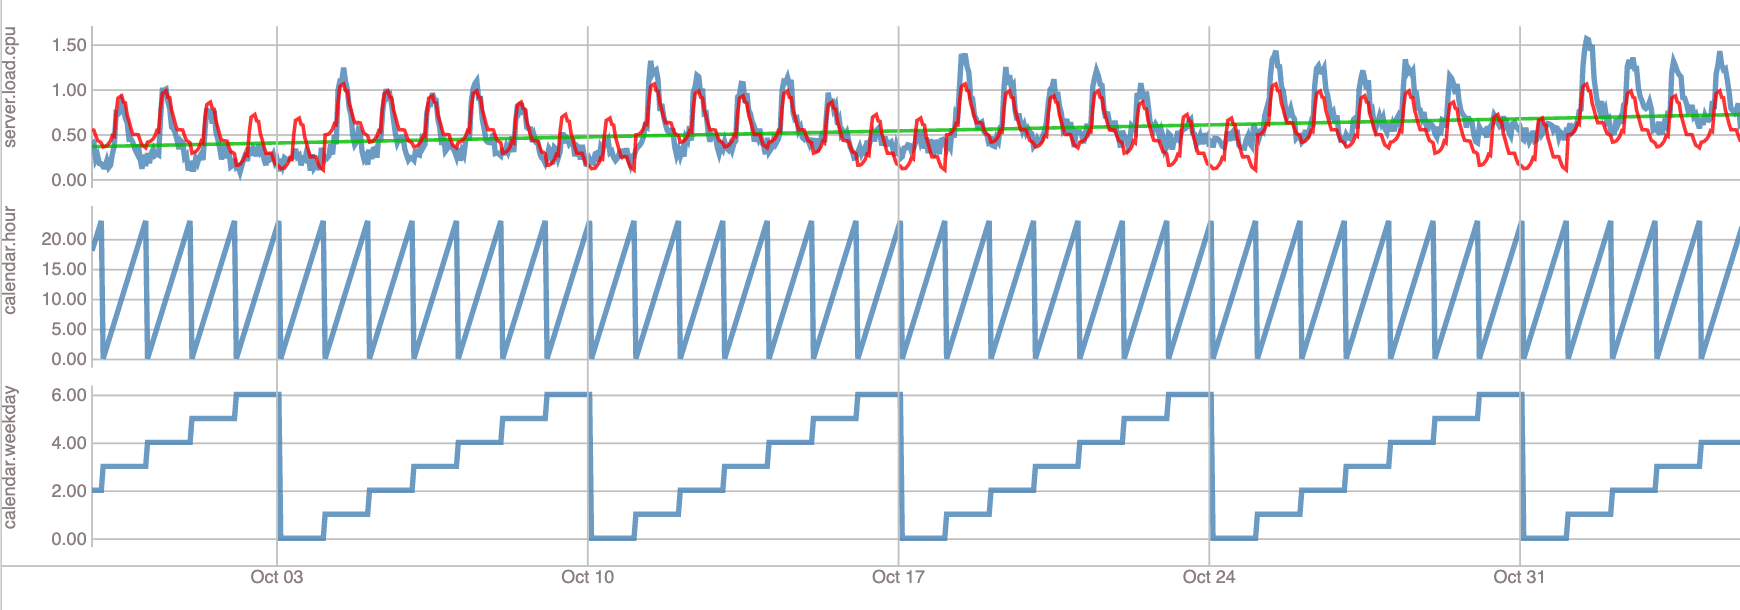
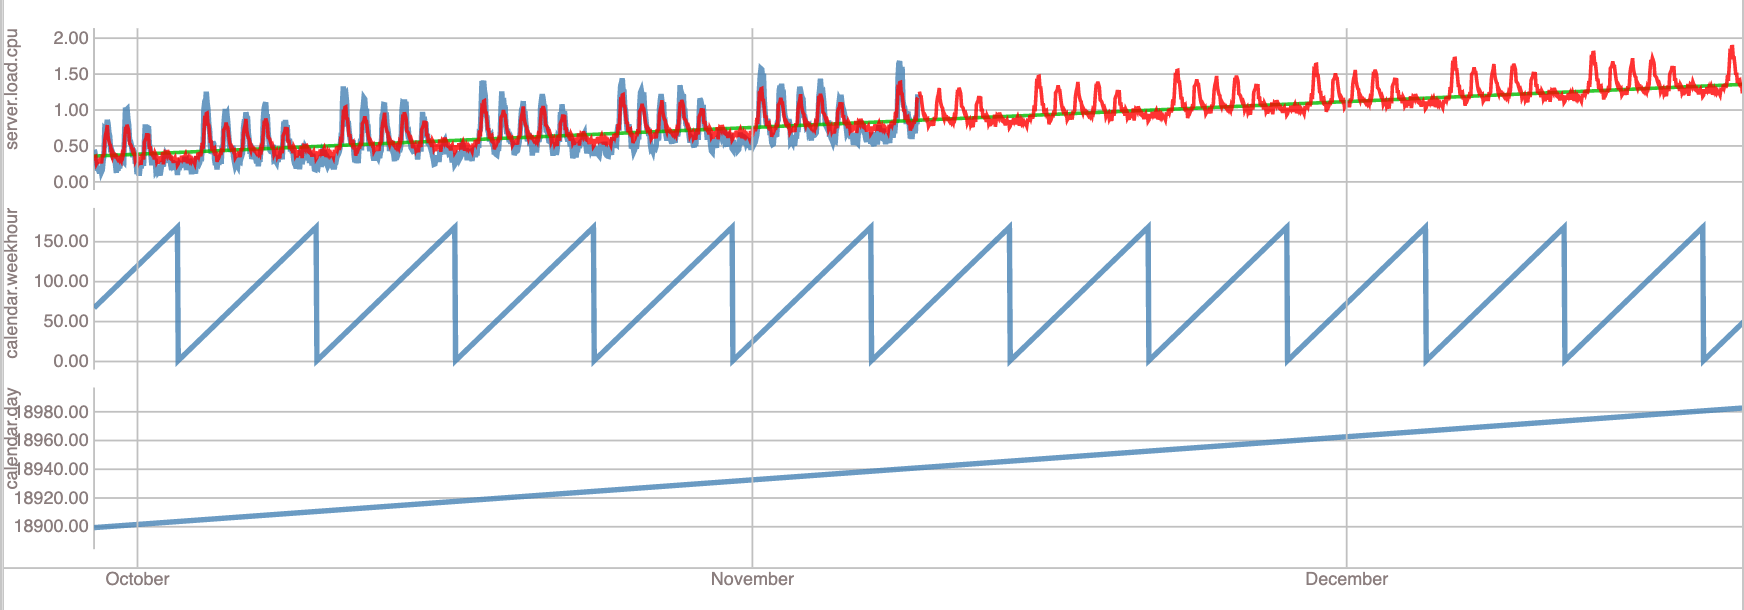
The example above shows that the hourly and daily patterns are detected quite well but there seems to be an upward trend as well that is not detected. This may be caused by an overall increase in CPU load over time as more users sign up for the service. The prediction can be made more accurate by adding a new input which is the number of days that the system is running. The predicted use now includes both the hourly and daily cyclic trend and the overall load increase.
Understanding cyclic trends can be helpful for anomaly detection. Instead of generating an alarm when the load is over a certain value the system can take into account the time of day and day of week to predict if this is normal. In this case a high load on monday at 11:00 may not trigger an alarm but a high load on sunday at 05:00 will. Likewise, a low load on monday morning may trigger an alarm because it is not predicted and may be caused by users unable to log in. The prediction model can be further refined by taking into account annual holidays or scheduled maintenance events.