SpaceTime data
Maps can also be used to create 4D visualizations of geospatial data. Geospatial data combines geospatial information with a temporal component, allowing for the analysis of geographic phenomena over time. This type of data is crucial for tracking and understanding how spatial elements change or move across different time intervals.
Data collection
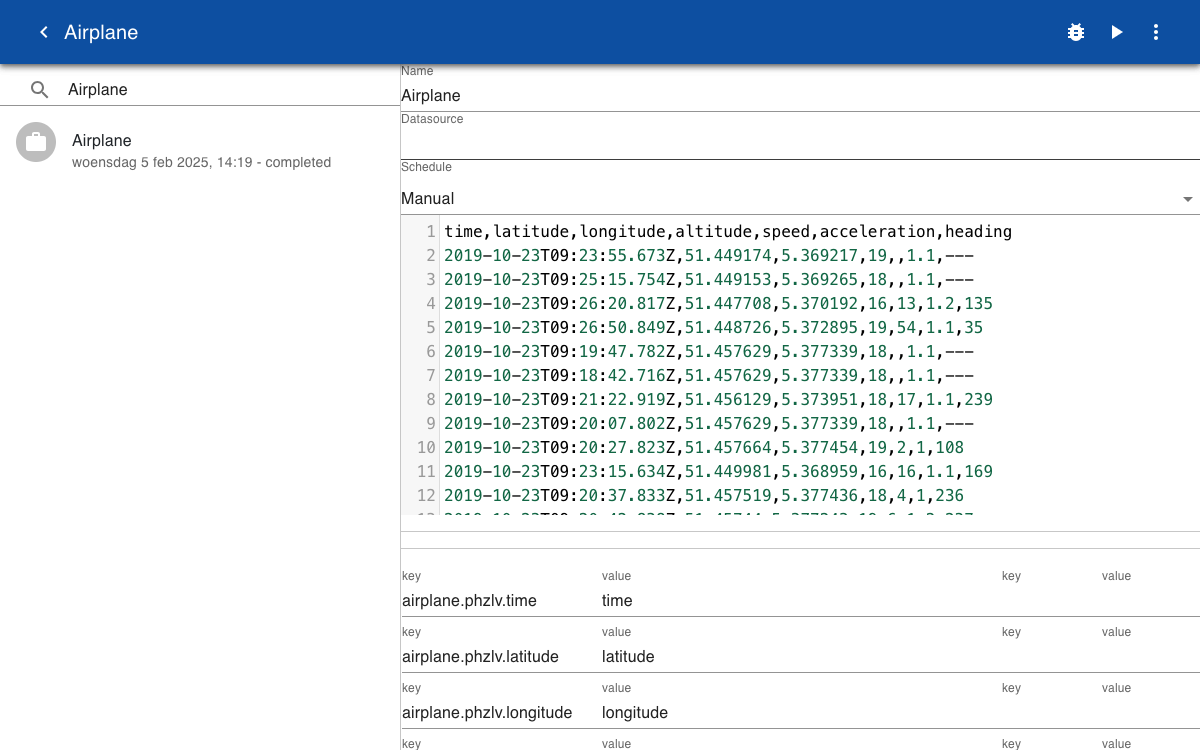
Examples of geospatial data are movements or airplanes or water heights in rivers. Live aircraft data can be downloaded from different sources such as OpenSky. The example below shows an CVS import of data collected with a mobile phone during a test flight.
Data display
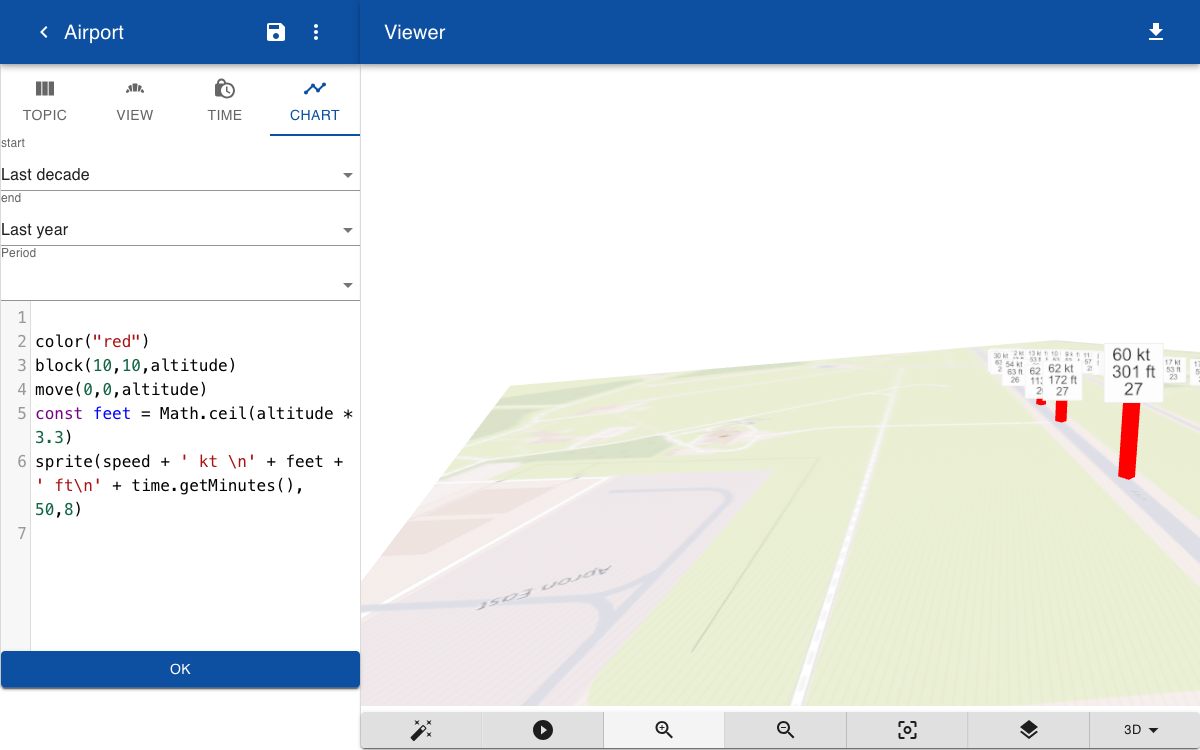
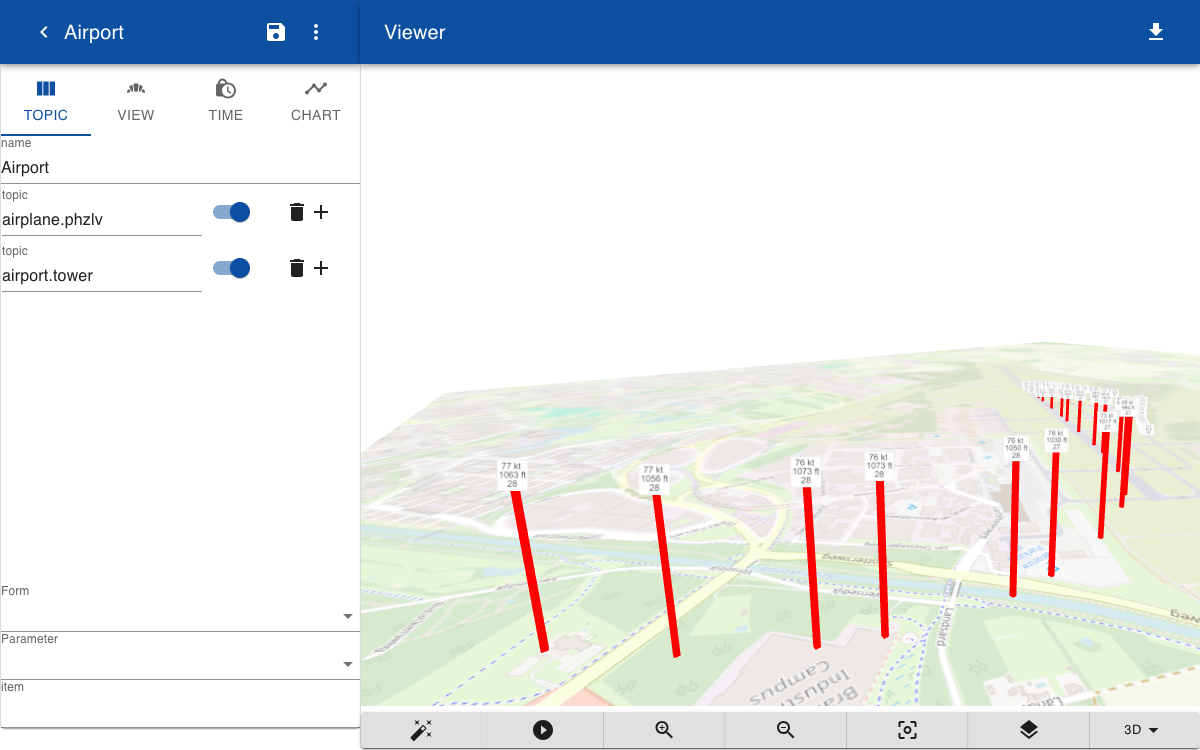
Create a new model and add the main topic airplane.phzlv. Click on the Chart tab and enter the timeframe for displaying the data. Since this example contains a very limited set we set the interval so that it collects the data from the last decade.
The chart tab includes an editor to define a script for representing each entry in the log file. In the script you can use any of the subtopics that have been imported such as speed, acceleration or heading, as well as the latitude, longitude, altitude, and time information. In the script we create a red block with the height equal to the altitude of the airplane defined by the altitude. A sprite(text, size, fontSize) function is used to display the value of the height in feet and the speed in knots.